
Figure 2.
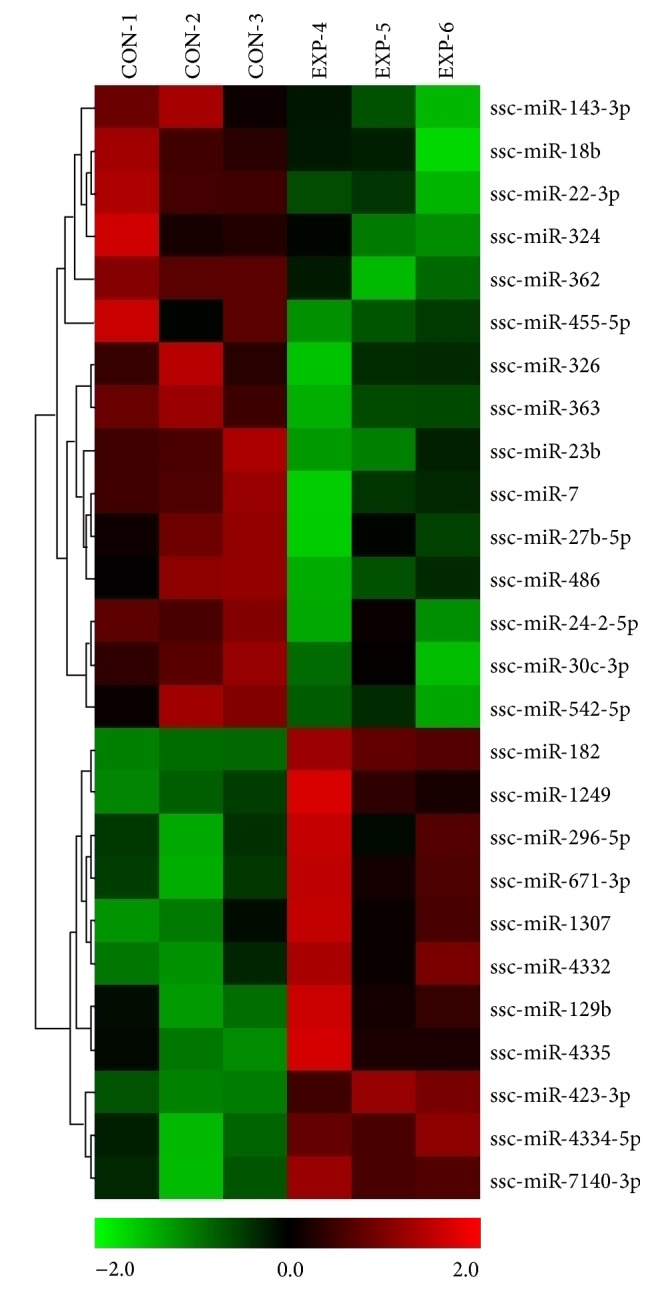
MicroRNA microarray expression profiling of the left atrium from paced versus nonpaced pigs. Heat map of the most differentially expressed (statistically significant) miRNAs in the left atrium of three paced (4–6) compared to three sham (1–3) animals. Relative expression is log2.