Figure 1.

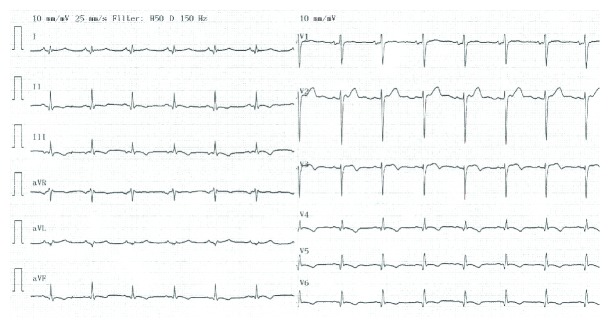
12-lead electrocardiogram obtained on day five of the index admission. Abnormal Q-waves are seen in the left sided leads I, aVL, and V4–V6. The QTc interval was normal at 395 msec (Fredericia correction).

12-lead electrocardiogram obtained on day five of the index admission. Abnormal Q-waves are seen in the left sided leads I, aVL, and V4–V6. The QTc interval was normal at 395 msec (Fredericia correction).