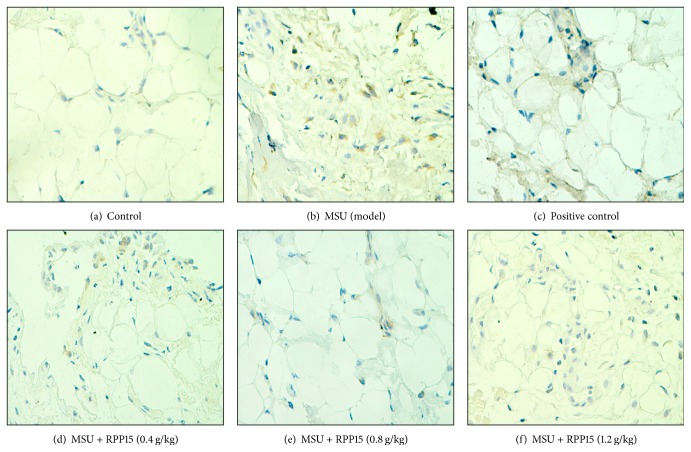
Figure 3.
The Illustrated levels of knee synovium NF-κB p65 immunoreactivity in control (Figure 3(a), ×400), MSU (Figure 3(b), ×400), MSU + indomethacin (Figure 3(c), ×400), and MSU + RPP15 (0.4, 0.8, 1.2 g/kg,) rats (Figures 3(d), 3(e), and 3(f), ×400).

