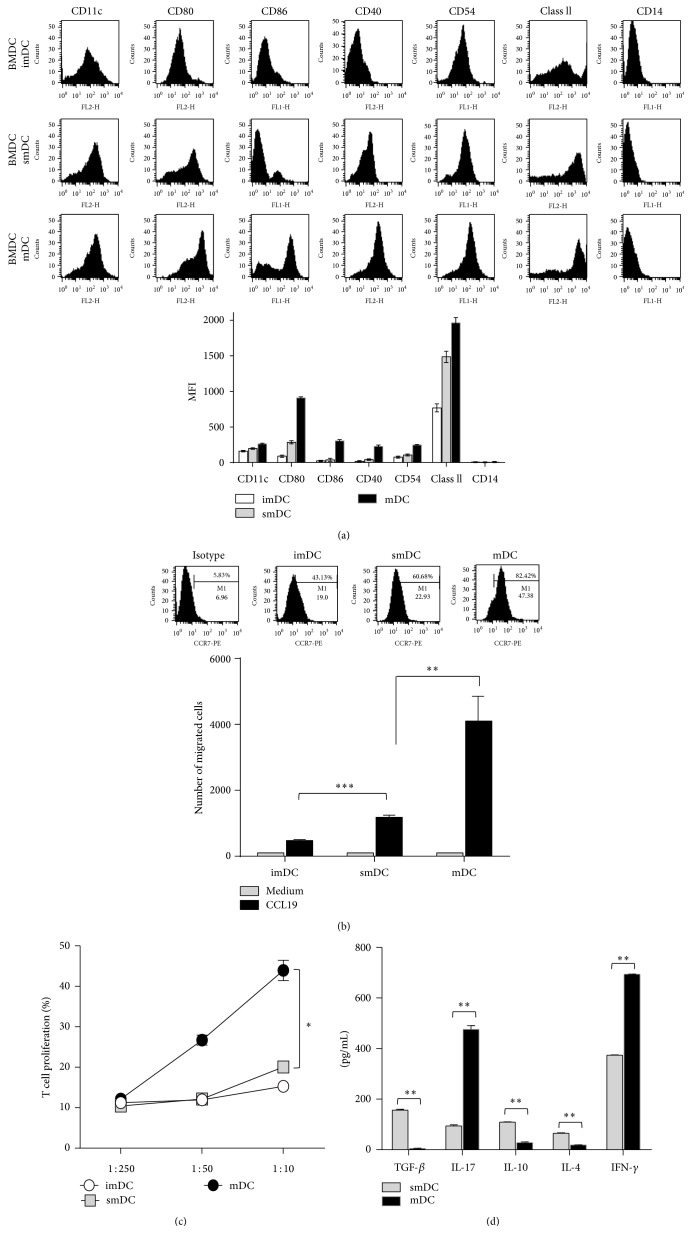
Figure 1.
Surface phenotypes and characteristics of smDCs. (a) Representative FACS data showing the surface phenotype of bone marrow cell-derived imDCs, smDCs, and mDCs (upper), and geometric mean fluorescence intensities (gMFI) of each surface molecule are shown (lower). (b) The expression level of CCR7 on the surface of imDCs, smDCs, and mDCs was assessed by FACS after staining with anti-CCR7 mAb. CCR7+ cell populations in each representative FACS data are indicated (upper). The migration of imDCs, smDCs, and mDCs was assessed by an in vitro CCL19/MIP-3β chemotaxis assay as described in Section 2. DCs were seeded in the upper chamber, and the number of migrated DCs was analyzed after 3 h. (lower). (c) T cell stimulation capacity of each DC subset. Purified CFSE-labeled splenic T cells were mixed with each syngeneic imDCs, smDCs, and mDCs at different ratios for 5 days. (d) Cytokine production was determined in primary cultures at DC/T cell ratios of 1 : 10. The supernatants were collected for IFN-γ, IL-10, IL-17, IL-4, and TGF-β production as determined by ELISA. The statistical data in (b)~(d) are shown as mean ± SEM from more than 3 independent experiments. ∗ p < 0.05, ∗∗ p < 0.01, ∗∗∗ p < 0.001 in Student's t-test.

