Figure 1.
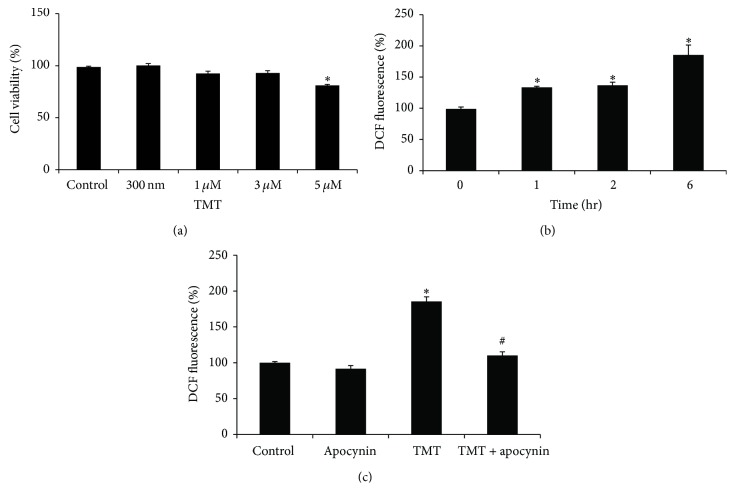
TMT-stimulated ROS generation in BV-2 cells. (a) For the cell viability test, the cells were treated with various concentrations of TMT (300 nM–5 μM) or vehicle (saline) for 24 hr; then MTT assay was performed to measure the cell viability. The value of each sample was normalized to control group. (b) For ROS measurement, 3 μM TMT treated cells was incubated for the indicated periods of time (0–6 hr) and then stained with 15 μM DCFH-DA for 30 min. DCF-fluorescence of each sample was analyzed by the flow cytometry. The value measured at 0 hr was set as 100%. The data are represented as mean ± SEM (n = 4). ∗ P < 0.05 compared with control (0 hr). (c) Cells were pretreated with 250 μM apocynin prior to TMT treatment and then incubated for 6 hr. The data are represented as mean ± SEM (n = 4). ∗ P < 0.05 compared with the value of control; # P < 0.05 compared with the value of TMT.

