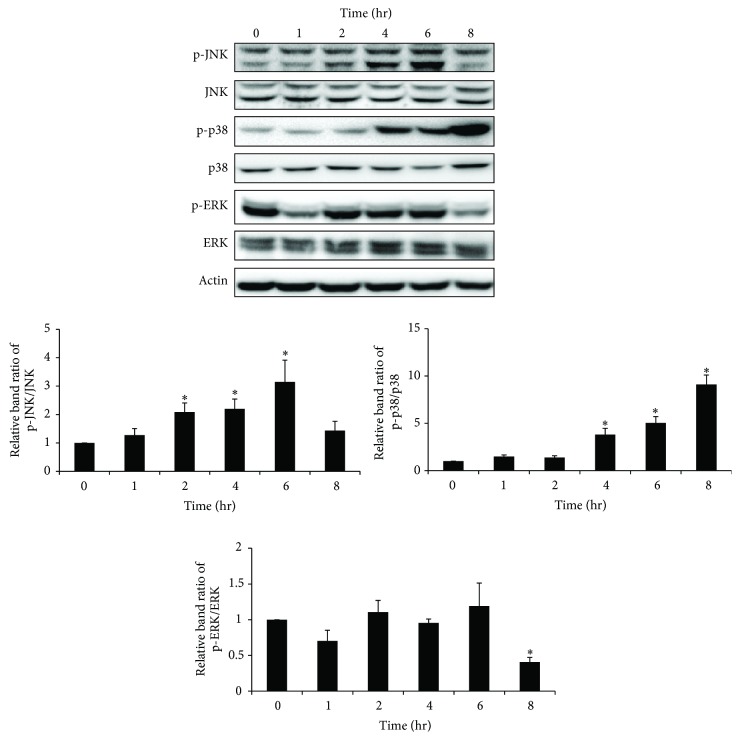
Figure 2.
p38 and JNK were activated by TMT exposure in BV-2 cells. Treated cells were analyzed by western blot at each time period. The bar graphs represent the band intensity of each phosphoform of MAPKs normalized to total. The data are represented as mean ± SEM (n = 5). ∗ P < 0.05 compared with the control group.

