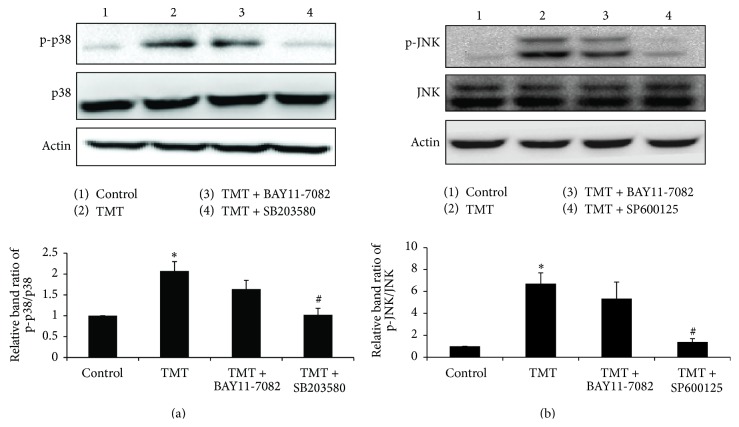
Figure 5.
p38 and JNK phosphorylation were followed by NF-κB activation upon the TMT exposure in BV-2 cells. Treated cells were collected at 6 hr and were subjected to western blot analysis. The bar graphs represent the band intensity of each phosphoform normalized to total. The data are represented as mean ± SEM (n = 5). ∗ P < 0.05 compared with the control group; # P < 0.05 compared with the value of TMT.

