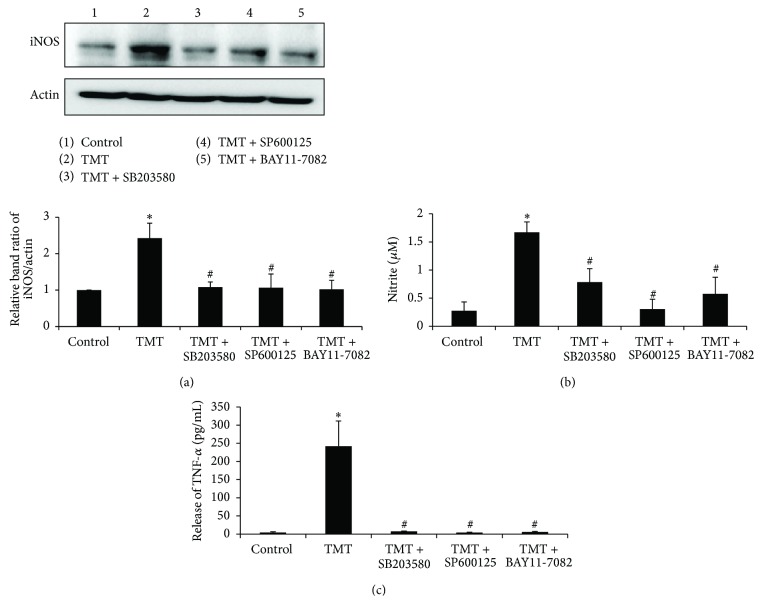
Figure 6.
TMT increased iNOS expression and the production of NO and TNF-α in BV-2 cells. (a) At 12 hr, the expression of iNOS was analyzed by western blot. The bar graphs represent the band intensity of each protein normalized to actin. (b) At 24 hr, the culture media were taken to assess the level of NO by Griess method. (c) The culture media were also transferred into TNF-α Elisa kit to measure the level of TNF-α released from the treated cells. The concentration of TNF-α (pg/mL) was measured by standard curve. The data are represented as mean ± SEM (n = 5–7). ∗ P < 0.05 compared with the control group; # P < 0.05 compared with the value of TMT.

