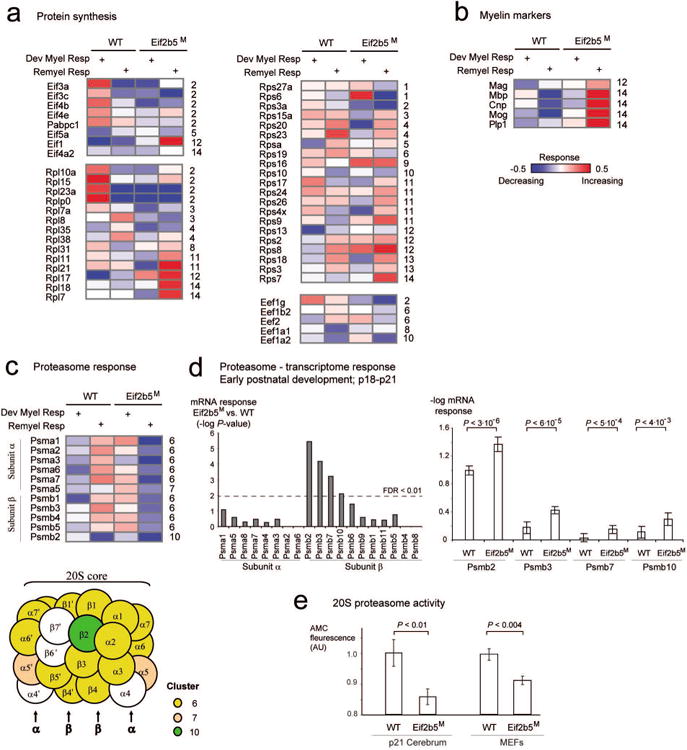
Fig. 4. Protein synthesis and degradation.

Each matrix presents response levels (rows) of proteins related to protein synthesis (a), myelin markers (b) and protein degradation (c) across four experiments (columns). The columns and color coding are shown as in Fig. 3a. For each protein, its symbol and cluster identifier are specified near the matrix (left and right, respectively; cluster identifiers are as in Fig. 3a). Notably, the proteasomal subunits α and β are specifically enriched in cluster no. 6; proteins that are part of these complexes are illustrated as circles and color coded by their response cluster identifier (c, bottom). (d) Analysis of transcriptome at p18 to p21 across proteasomal subunits α and β. Left: the histogram presents P-values for the difference between p18-p21 mRNA responses in WT versus Eif2b5M strains (y axis) across proteasomal subunits α and β (x axis). Right: Average -log mRNA responses (y axis) for WT and Eif2b5M strains across three exemplified proteasomal subunits β genes (x axis). Statistical t-test P-values are shown on top and summarized in the left panel of this figure. (e) Shown is 20S proteasome activity (y axis), which is defined as fluorescence level of free 7-Amino-4-methylcoumarin (AMC) fluorophore following cleavage of labeled LLVY-AMC substrate (Methods). Protein extracts from WT and Eif2b5M MEFs (right) or p21 brains (left) were used (x axis). Shown is average ±SD of 7 experiments (right) or 9 WT and 10 Eif2b5M brains (left).
