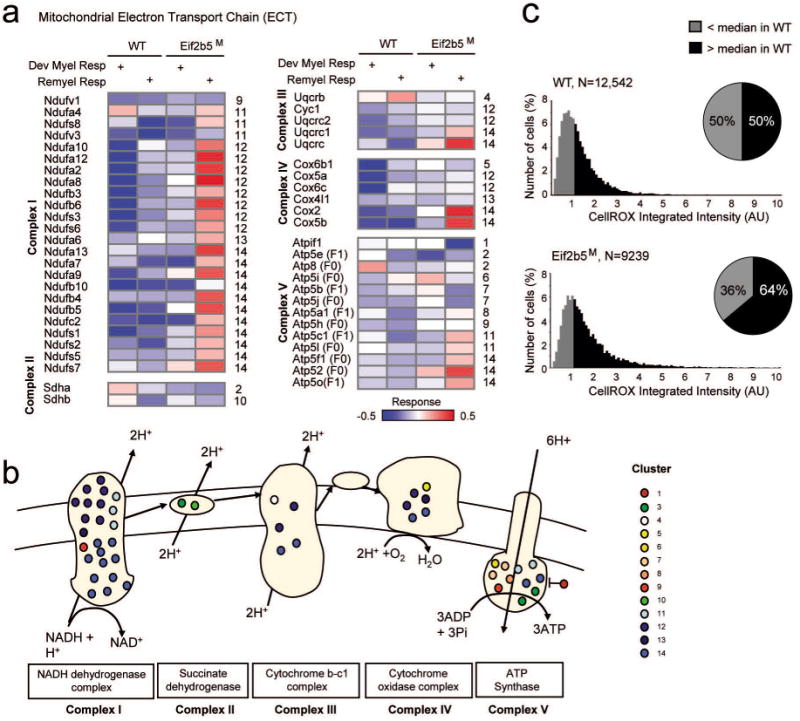
Fig. 5. Mitochondrial electron transport chain (ETC) and ROS levels.

(a) Each matrix presents all proteins related to an ETC complex (rows) across experiments (columns). The columns and color coding are shown as in Fig. 3a. (b) Shown are complexes I-V. Proteins that are part of these complexes are illustrated as circles and color coded by their response cluster identifier. (c) WT and Eif2b5M MEFs were stained with Hoechst 33258 and CellROX as detailed in Methods. N= number of cells. Shown is the cellular CellROX integrated intensity. The median of CellROX integrated intensity in WT cells was set as a threshold and used to classify sub-populations of cells. ROS-positive (black) or negative (gray) cells are above or below this threshold, respectively. χ2-test of independence P-value <10-94 for the difference between the two pie charts, indicating higher proportion of Eif2b5M cells are ROS-positives compared to WT cells.
