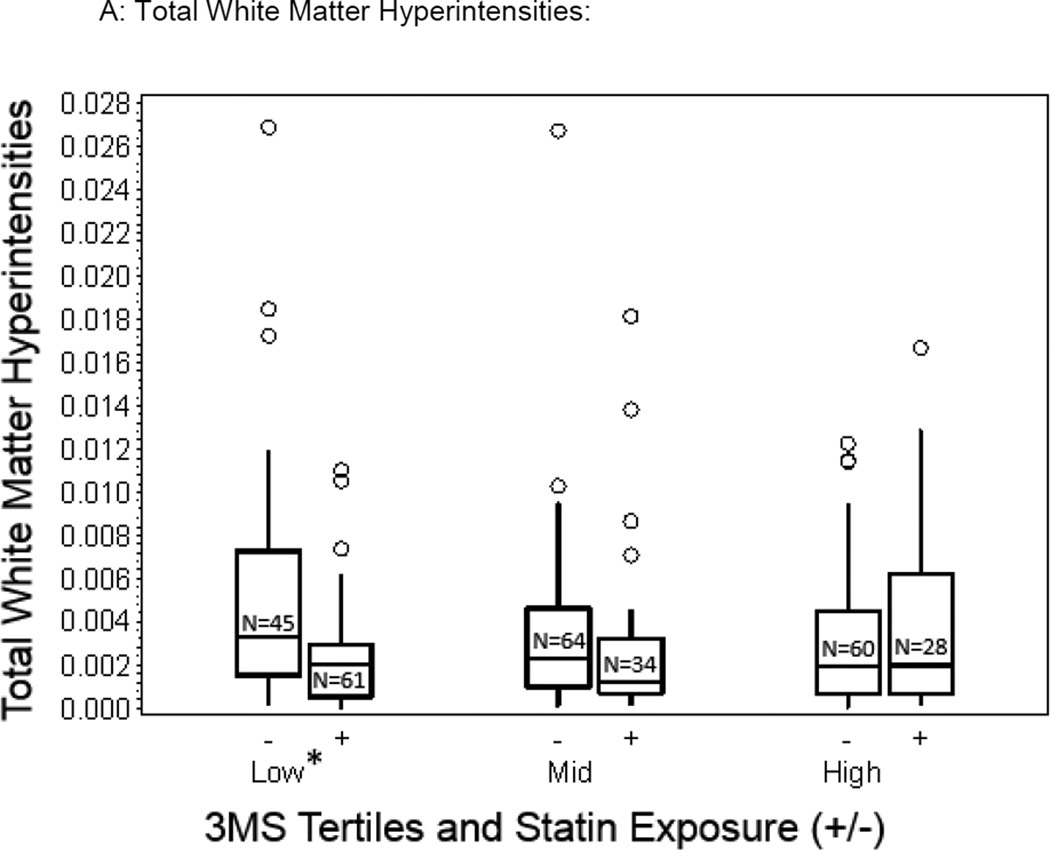
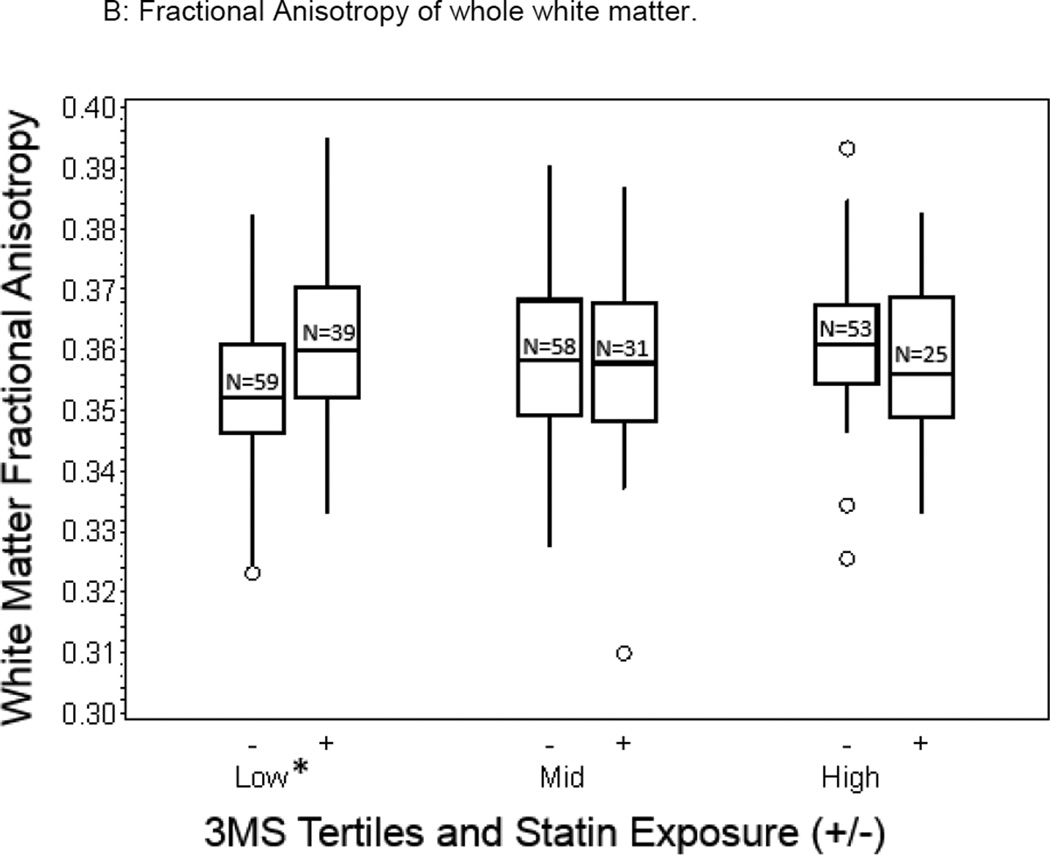
Figure 1.
Box plots depicting unadjusted differences in total WMH and whole WM FA values in statin exposed and statin unexposed older adults across the 3MS tertiles (Lowest tertile: 3MS score of 59 to 92, mean=86; Middle tertile: 3MS score of 93 to 96, mean=95; Highest tertile: 3MS score of 97 to 100, mean=98; statistically significant adjusted differences are denoted by an asterix (p<0.05)).


