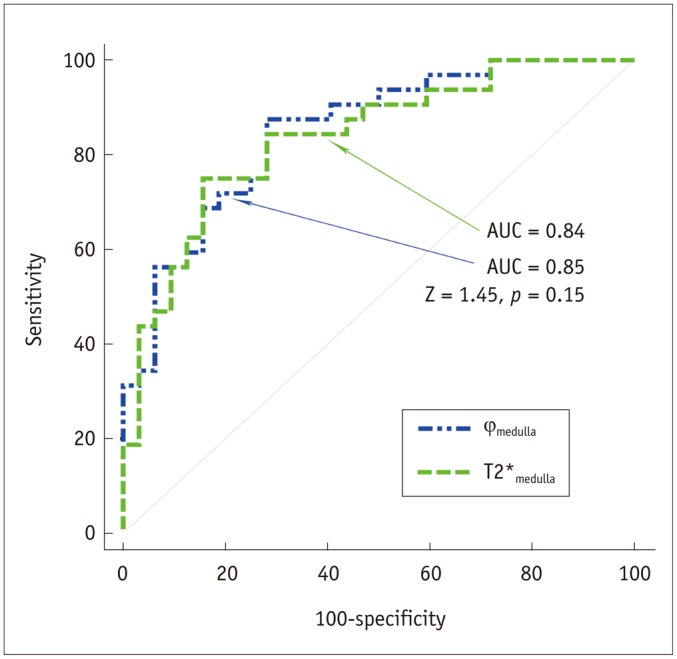
Fig. 4. Receiver operating characteristics curve analysis of two methods for detecting changes in renal oxygenation levels due to water loading.

Area under receiver operating characteristic curve (AUC) was not significantly larger for medullary phase (φmedulla), as measured using susceptibility weighted imaging, than medullary T2* values (T2*medulla) using T2* map.
