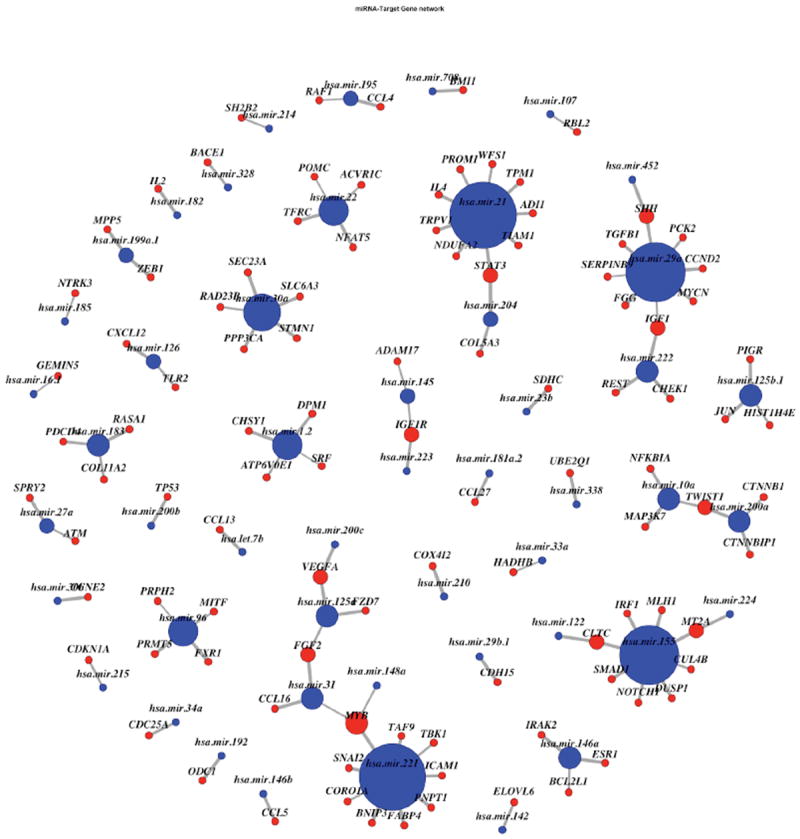
Figure 2.

miRNA regulatory network using a threshold of 0.5 on its marginal posterior probability. The diameter of each node is proportional to its number of edges. Thicker edges correspond to higher marginal posterior probabilities. Red nodes correspond to genes; blue nodes correspond to miRNAs.
