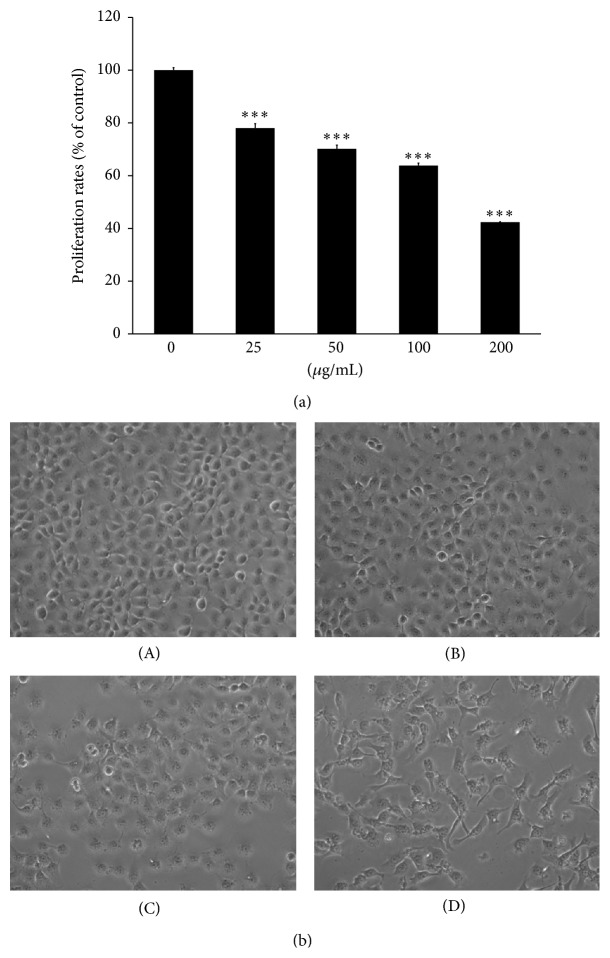
Figure 1.
MEPT-induced inhibition of proliferation and changes in cell morphology. HSC-4 cells treated with 0, 25, 50, 100, or 200 μg/mL of MEPT for 24 h were analyzed using an MTT assay (a). MEPT caused a change in cell morphology consistent with autophagy in HSC-4 cells (original magnification, ×200). Cells were treated with (A) 0 μg/mL, (B) 25 μg/mL, (C) 50 μg/mL, or (D) 100 μg/mL of MEPT for 24 h (b). Results are presented as the means ± standards deviation of three independent experiments. ∗∗∗ P < 0.001 versus nontreated control.

