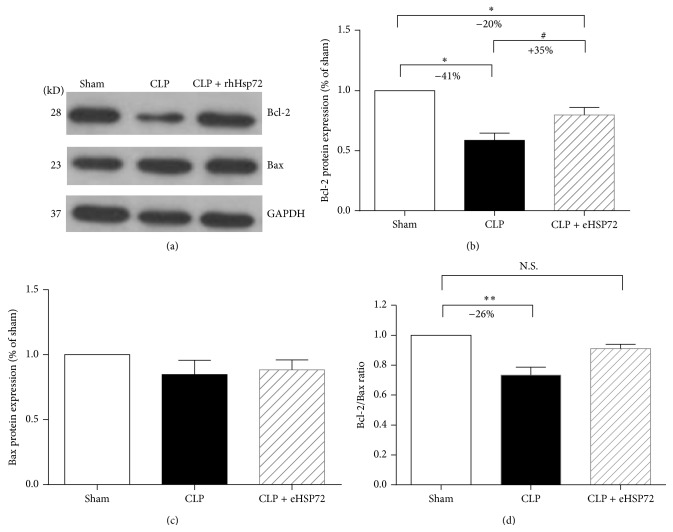
Figure 3.
Effects of rhHsp72 on Bcl-2 and Bax expression in livers of rats with sepsis. Experiments were conducted as described in Section 2. Panel (a) is the Western blots showing the expression levels of Bcl-2, Bax, and GAPDH. Panels (b) and (c) present the intensity of the signals of Bcl-2 and Bax quantified using densitometry after normalization with that of GAPDH. Panel (d) represents the Bcl-2/Bax ratio. Values are mean ± standard error of the mean. Each group contained 12 animals. ∗ p < 0.05, ∗∗ p < 0.01 and N.S. versus sham; # p < 0.05; versus CLP.

