
Figure 2.
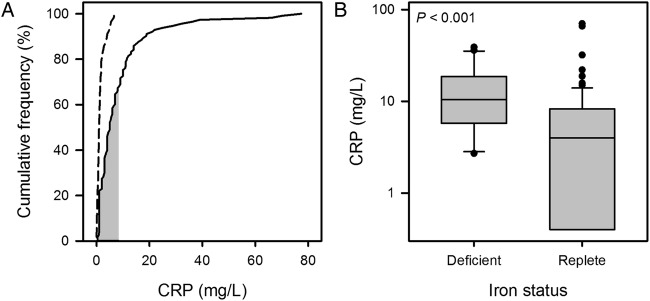
(A) Cumulative frequency plot for C reactive protein (CRP). Data for the chronic obstructive pulmonary disease (COPD) cohort are plotted with a solid line and those for the control cohort with a dashed line; the shaded area indicates the normal range for the assay. (B) Box plot (boxes show IQR and median, whiskers show 10th and 90th centiles, circles are outliers) showing distribution of results for CRP by iron status in the COPD cohort. CRP was significantly higher in the iron-deficient (ID) group (median 10.5 vs 4.0 mg/L, p<0.001).