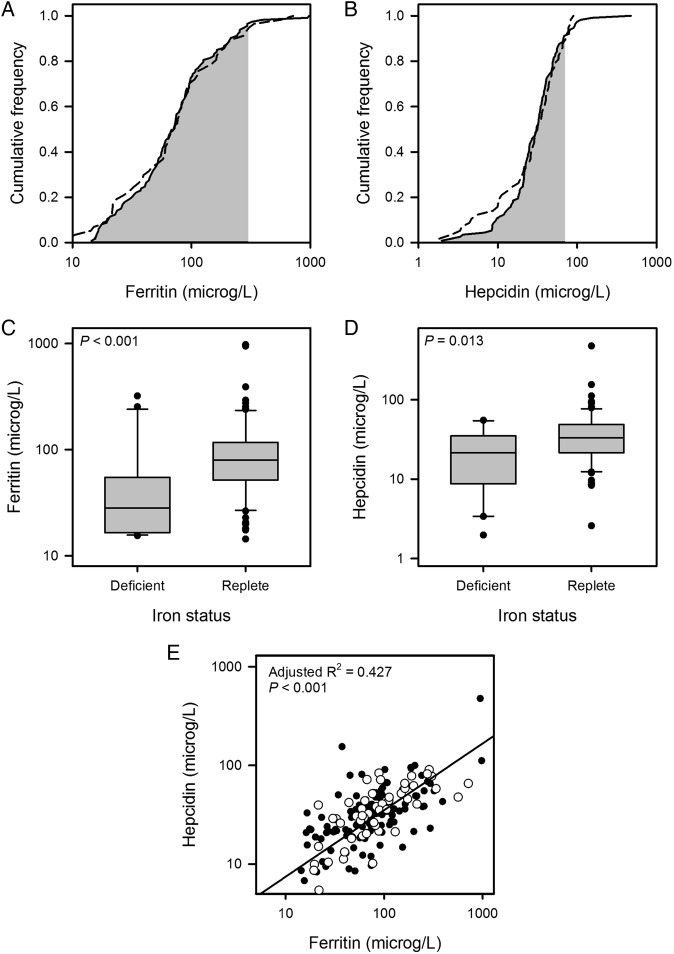
Figure 3.
(A and B) Cumulative frequency plots for ferritin and hepcidin. Data for the chronic obstructive pulmonary disease (COPD) cohort are plotted with a solid line and those for the control cohort with a dashed line; the shaded area indicates the normal range for each assay. (C and D) Box plots showing distribution of results for ferritin and hepcidin by iron status in the COPD cohort. Ferritin (median 28.3 vs 79.9 µg/L; p<0.001) and hepcidin (median 21.4 vs 33.4 µg/L; p=0.013) were both lower in the iron-deficient (ID) group. (E) Scatter plot showing relationship between hepcidin and ferritin in the COPD cohort (filled circles) and control cohort (empty circles); the regression line is for both groups taken together; individual regression lines were not significantly different.

