
Figure 5.
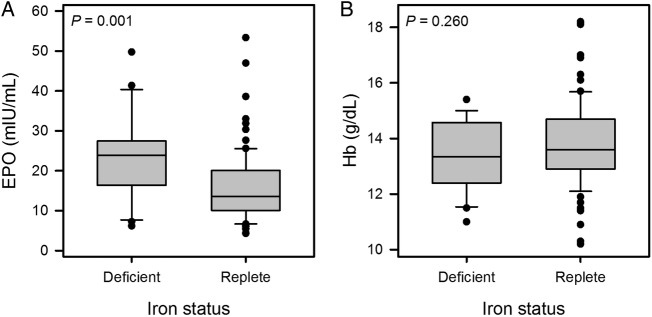
Box plots showing distribution of (A) erythropoietin (EPO) and (B) haemoglobin (Hb) concentration, by iron status in the chronic obstructive pulmonary disease (COPD) cohort. EPO was significantly higher in the iron-deficient (ID) group (median 23.9 vs 13.5 mIU/mL, p=0.001) but Hb did not differ (mean 13.4 vs 13.8 g/dL; p=0.260).