Figure 2.

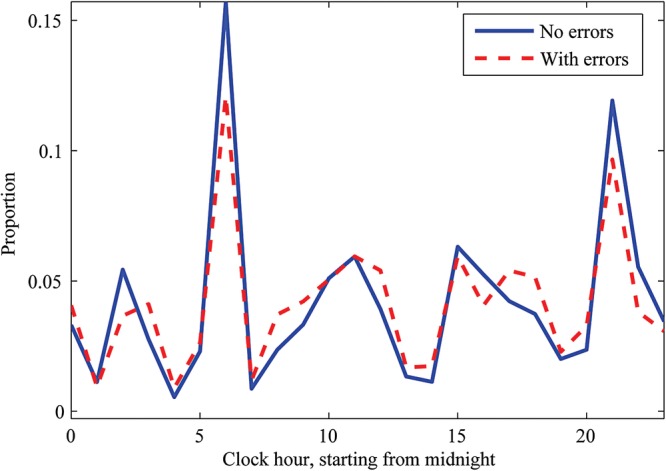
Distribution by hour of observation sets with (dashed line) and without (solid line) errors in assignment of scores to vital sign values, or errors in the aggregate score.

Distribution by hour of observation sets with (dashed line) and without (solid line) errors in assignment of scores to vital sign values, or errors in the aggregate score.