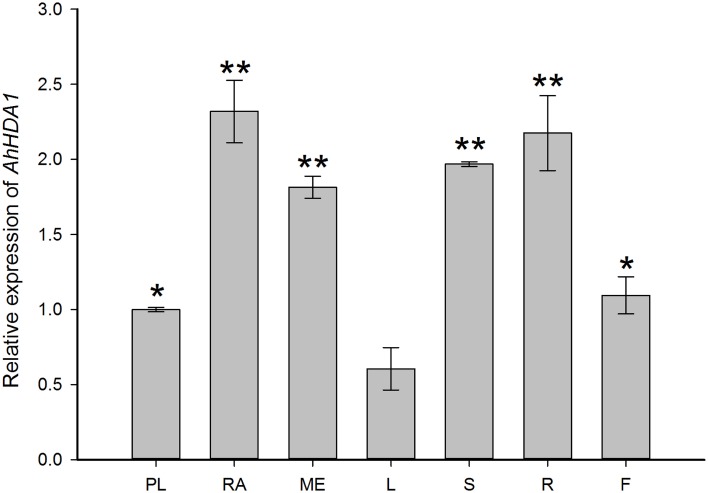
Figure 3.
Quantitative RT-PCR validations of AhHDA1 expression in different peanut tissues. Column chart showing expression of AhHDA1 in PL, plumule; RA, radicle; ME, mesocotyl; L, leaf; S, stem; R, root; and F, flower, respectively. Plumules, radicles, and mesocotyls were taken from peanut embroys which had been cultivated for 7 days germination. Leaves stems and roots were taken from four-leaf stage peanut seedlings. Flowers were taken from peanuts during budding. All plants were grown as started in Materials and Methods. All values ± Standard Error (SE) for n = 3 biological replicates. Each graph displays the mean and SD of three independent experiments. */**, different from control as revealed by t-test, p < 0.05/p < 0.01.

