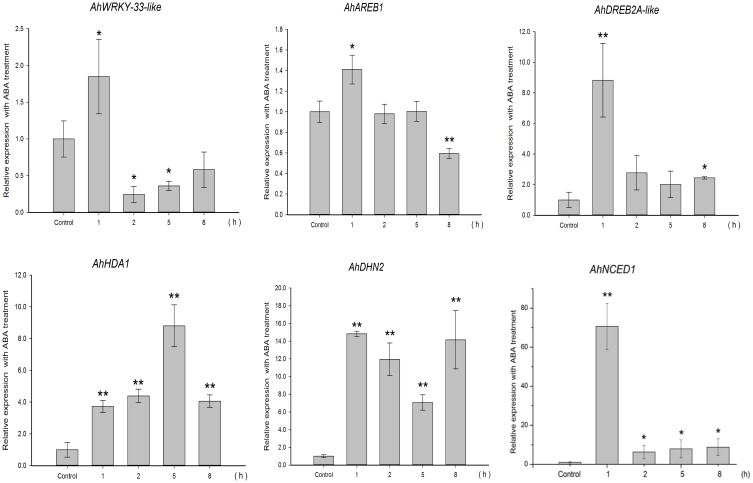
Figure 4.
Expression analyses of AhHDA1 and stress resistance genes following ABA treatment by qRT-PCR. Time points of 1, 2, 5, and 8 h were sampled to observe the changing trend. The untreated group was used as the control (no chemical treatment). Each graph shows the mean and SD of three independent experiments. */**, different from control as revealed by t-test, p < 0.0.5/p < 0.01.

