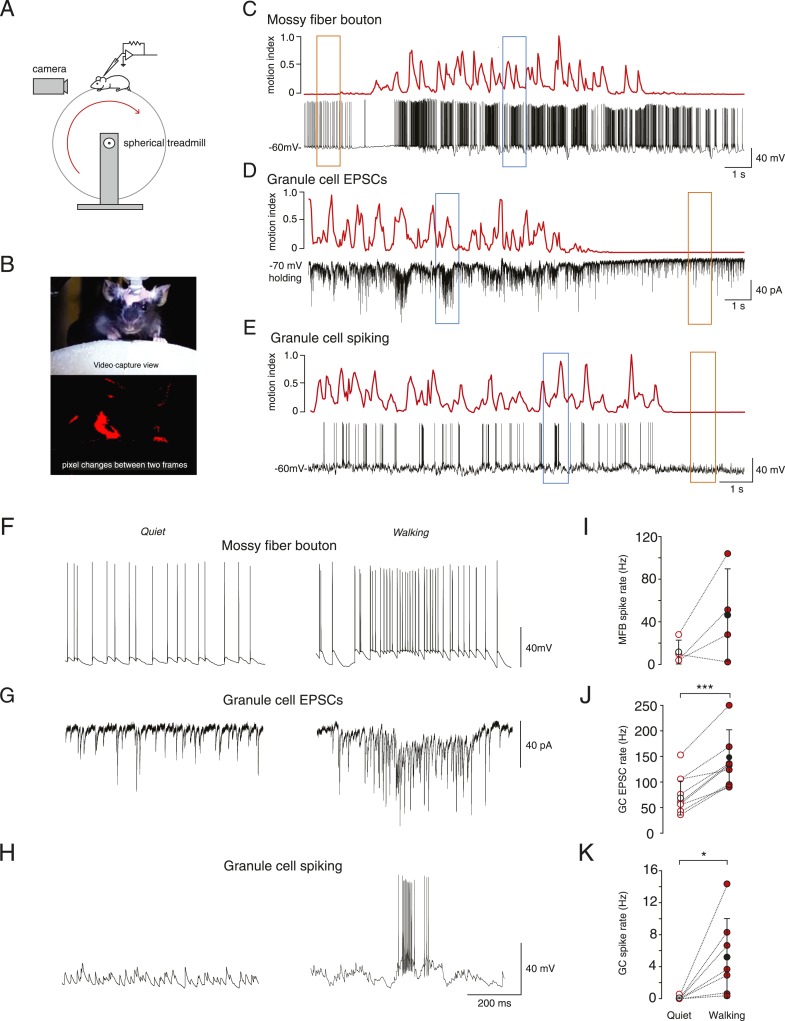
Figure 1. Whole-cell recordings from granule cells and mossy fibers during locomotion.
(A) Schematic of recording configuration. (B) Calculation of motion index. Top panel: a single frame from a video of a mouse walking on the treadmill. Bottom panel: pixel intensity variation between the frame shown in the above panel and the previous frame are highlighted in red. The pixel variation between each frame was quantified for each video to give a continuous signal relating to average motion of the mouse (motion index calculated as described in the ‘Materials and methods’ and normalized to the maximum value in the video). (C–E) Example whole-cell recordings (black) from a presynaptic mossy fiber terminal (C), a granule cell recorded in voltage-clamp mode (D) and a granule cell recorded in current clamp mode (E), together with the corresponding motion index (red). (F–H) Section of each example trace shown in C–E at a higher timescale show spontaneous input recorded during a quiet period (left panels, orange frames in (C–E) indicate the location within the trace) and typical bursts of activity during locomotion (right panels, blue frames in (C–E) indicate the location within the trace). Summary data comparing the average instantaneous frequencies of mossy fiber spikes (I, n = 4 in 4 mice), granule cell EPSCs (J, n = 9 in 6 mice) and granule cell spikes (K, n = 6, in 4 mice). Mean group averages are indicated with black open and closed circles, error bars indicate standard deviation.

