Figure 4.

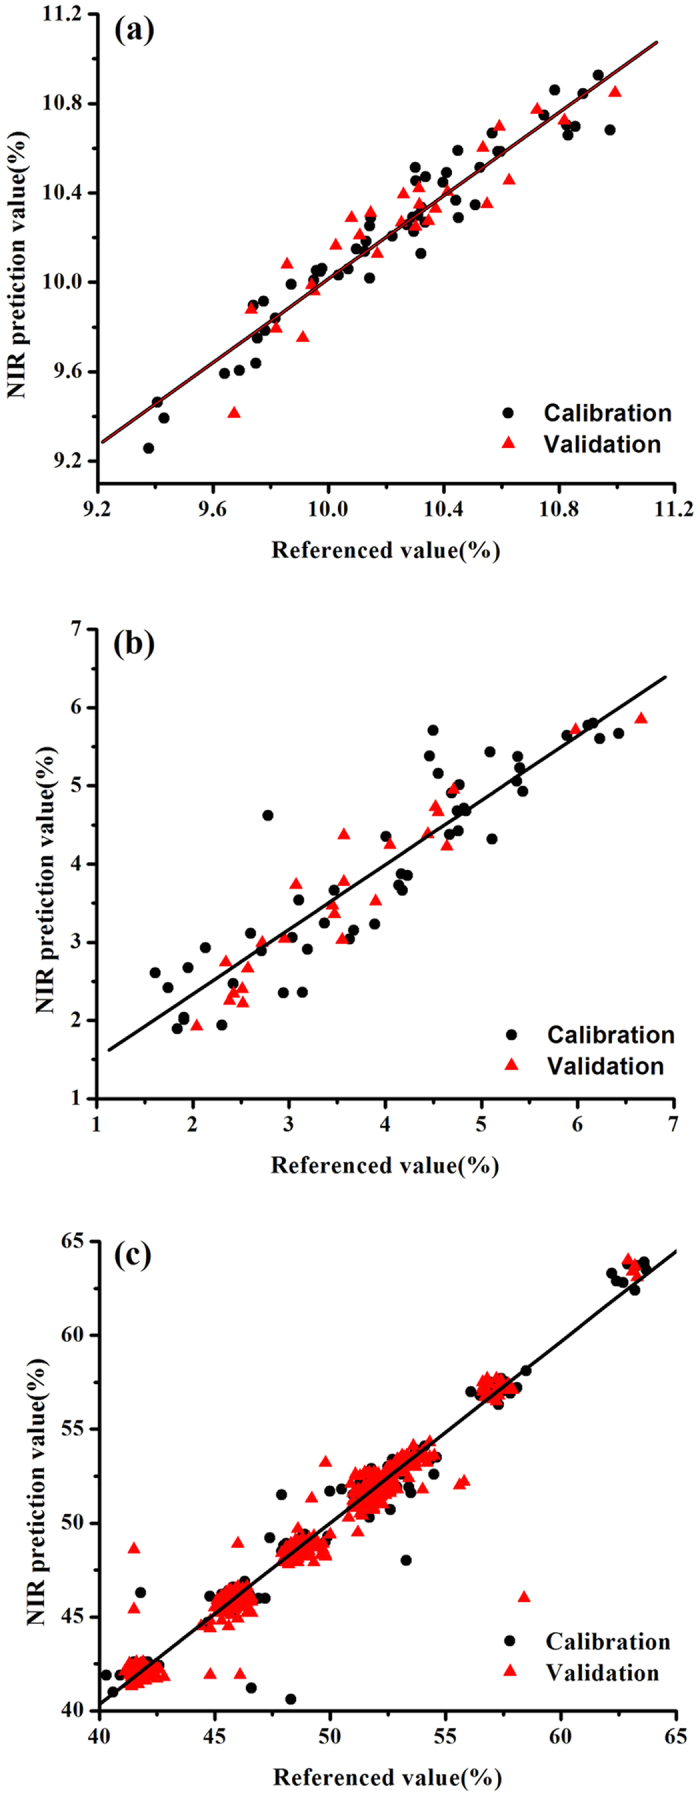
Correlation between the prediction and reference values of corn samples (a), Yinhuang granules samples (b) and pharmaceutical tablets sample (c).

Correlation between the prediction and reference values of corn samples (a), Yinhuang granules samples (b) and pharmaceutical tablets sample (c).