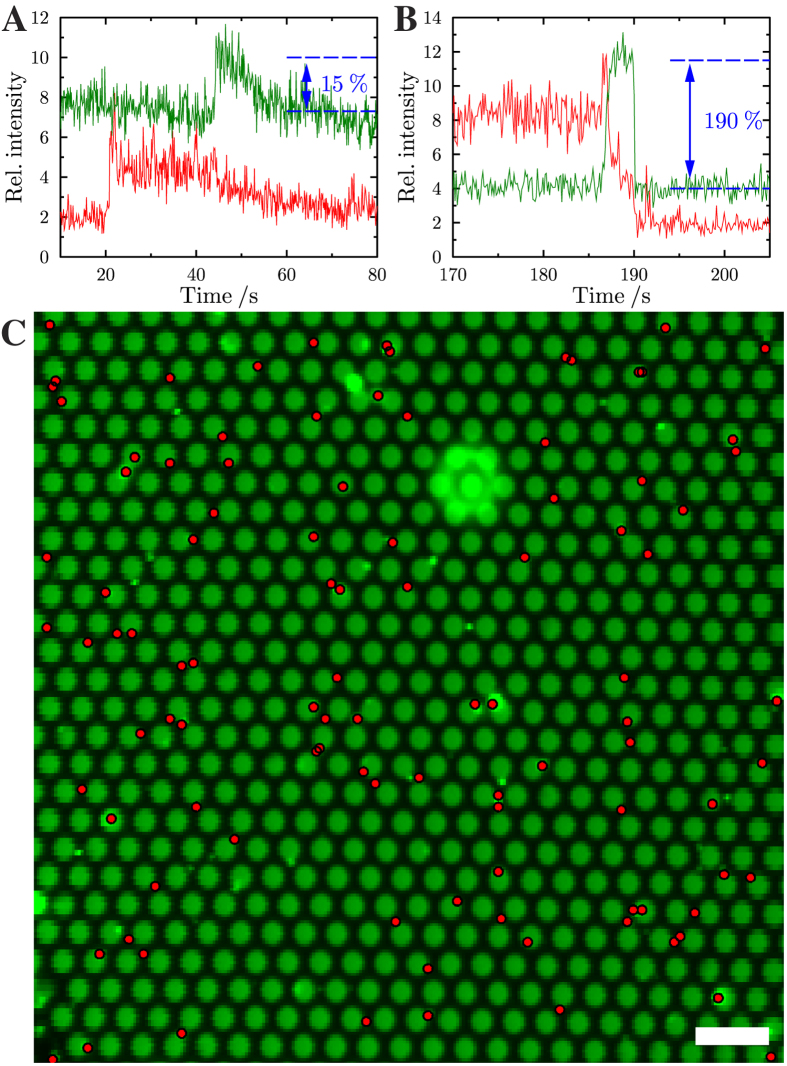
Figure 4.
Time resolved changes in fluorescence intensity of Oregon Green DHPE (green) and Texas Red DHPE (red) during (A) a fusion event occurring in the center of the pore-spanning membrane and (B) occurring with a pore-spanning membrane attached to the pore rim. (C) Averaged Oregon Green fluorescence image. The red dots mark the positions of the centers of mass of the docked vesicles. Scale bar: 4 μm.

