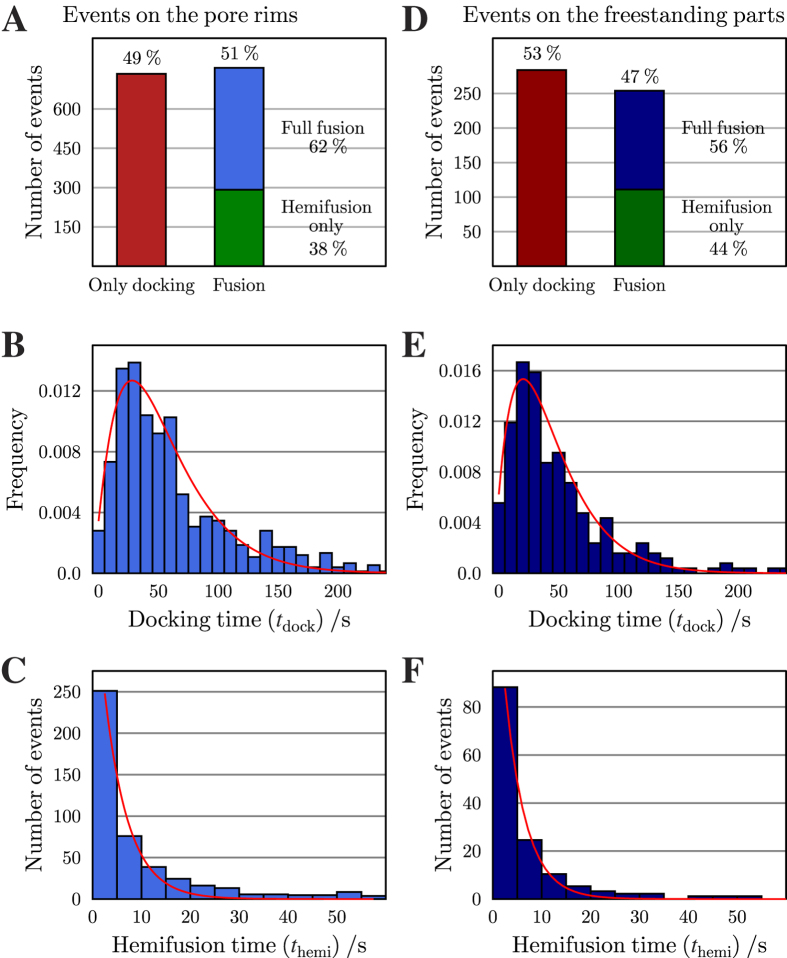
Figure 6.
Statistical analysis of the fusion events on the pore rim attached membranes (A–C) and on the freestanding parts (D–F). (A,D) Number of vesicles that only dock, dock and fuse but stay in the hemifused state and vesicles that fully fuse with the membrane. (B,E) Histogram of the docking time tdock. The red lines are results of fitting eq. (1) to the data. (C,F) Histogram of the hemifusion time themi. The red line is the result of fitting eq. (2) to the data.

