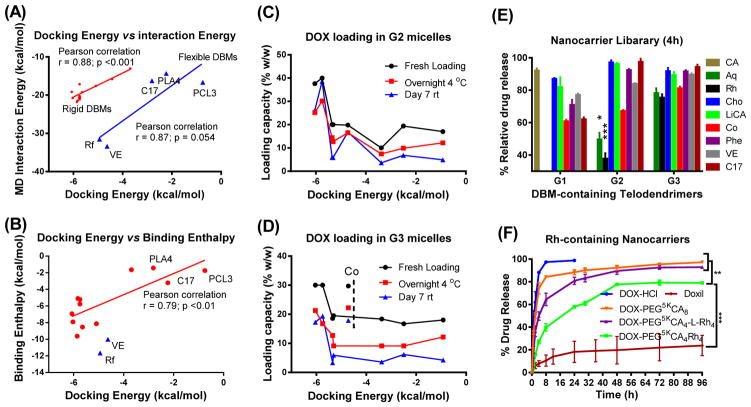
Figure 3. Methodology validation and systematic evaluation.
(A, B) Most favorite docking conformations between DBM-DOX were simulated by molecular dynamics for 5 ns in the present of explicit water. (A) Unbound interaction energy computed from MD simulations plotted against the minimum docking energies. (B) The binding enthalpies analyzed by a solvent-balance method were plotted against the lowest docking energies. Linear regression model was fit via Ordinary Least Square to calculate the Pearson correlation coefficient and the associated p values. (C, D) Drug loading capacities of G2 (C) and G3 (D) telodendrimer micelles at fresh loading and after storage were plotted against docking energies of the DBMs. (E) Percentage of DOX release from G1, G2 and G3 telodendrimer micelle library relative to the release rate of free DOX and PEG5kCA8 at 4 h. (F) In vitro drug release profiles were studied using a dialysis method under sink condition for free DOX, Doxil and DOX loaded in various telodendrimer nanocarriers. Data were presented as mean ± SEM (n=3). Student’s t-test: *P<0.05; **P<0.01; ***P<0.001.

