
Figure 2.
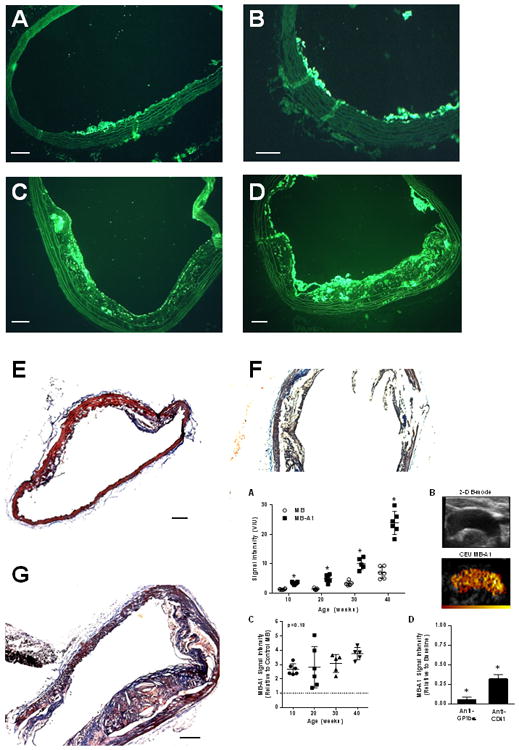
(A) Signal intensity (bars: mean±SEM) for in vivo CEU molecular imaging of the thoracic aorta with platelet-targeted MB-A1 and control MB in DKO mice. *p<0.01 versus corresponding control MB; Kruskal-Wallis p=0.0002 for increase in MBA1 signal with age. (B) Example of a 2-D ultrasound image of the thoracic aorta and background-subtracted CEU molecular imaging (color scale at bottom) obtained after I.V. injection of MB-A1. Examples from all ages are shown in the Supplemental Figure 3. (C) Signal intensity (mean±SEM) for MB-A1 displayed relative to control MB (Kruskal-Wallis p=0.13). The dashed line represents equivalency of signal to control MB. (D) Mean (±SEM) signal intensity on CEU with platelet-targeted MB-A1 after platelet depletion with either anti-GPIbα or anti-CD41 mAb which reduced circulating platelet count by approximately 90% and 50%, respectively. Data are shown relative to baseline pre-treatment values. *p<0.05 versus baseline.