
Figure 3.
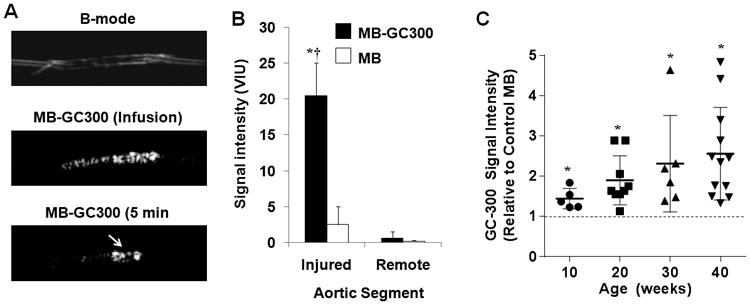
(A) Images illustrating ex vivo aortic crush injury experiments used to validate MB-GC300 attachment to VWF. Images show a B-mode 2-D ultrasound imaging of an aorta cannulated at each end, CEU images acquired during infusion of MB-GC300 and after the 5 minute wash, and en face fluorescent microscopy of the aorta at the site of injury performed after CEU imaging. A focal region of enhancement is seen (arrow) at the injury site which corresponds to the region of injury. (B) Signal intensity (mean±SEM) signal intensity for CEU imaging of the ex vivo aortas at the injured and remote segment for MB-GC300 and control MB. *p=0.005 vs MB; †p=0.001 vs remote segment. (C) Mean (±SEM) signal intensity on in vivo CEU molecular imaging of the thoracic aorta for MB-GC300 displayed relative to control MB. The dashed line represents equivalency of signal to control MB. *p=0.005 vs MB; Kruskal-Wallis p=0.08 for increase in signal according to age.