
Figure 5.
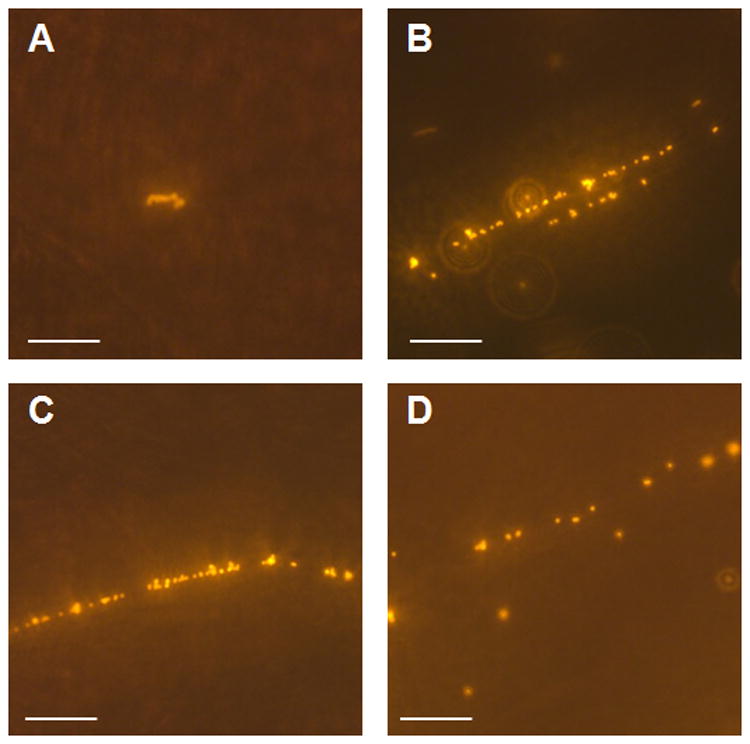
Representative examples of en face microscopy of the aortic endothelial surface in the flow chamber after infusion of fluorescent nanospheres bearing GPIbα- in (A) 20 week DKO mouse, (B to D) 40 week DKO mice. In the 40 week DKO mice, although single nanopheres were seen, the majority of adhesive events were in the form of linear aggregates. Scale bar = 20 μm. An example of the undulating mobile appearance of the strings is shown in the Video Supplement.