
Figure 3. ER-localized oxBFP has greater fluorescence intensity.
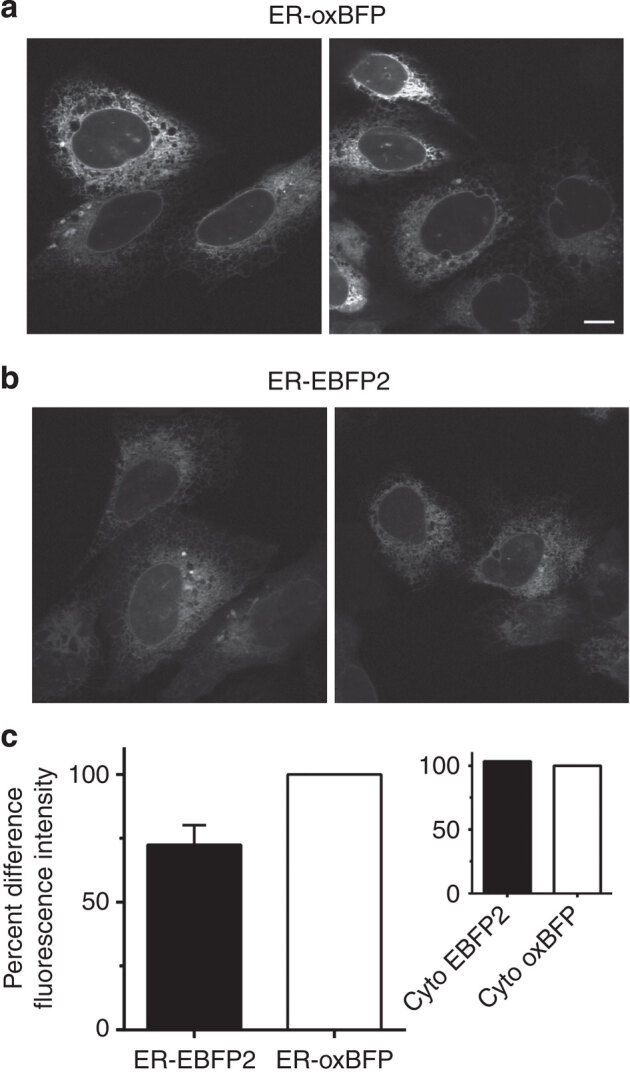
Representative images taken with identical imaging conditions of live U-2 OS cells transiently transfected (16 h post transfection) with (a) ER–oxBFP or (b) ER–EBFP2 illustrate the higher fluorescence level of the cysteine-less variant; scale bar, 10 μm. (c) Quantification of the percent difference of relative mean fluorescent intensity of the ER fluorescence signal ER–EBFP2 has an ∼27% decrease in brightness, total n=250 cells (ER–EBFP2 73 cells, ER–oxBFP 72 cells, Cyto-EBFP2 43 cells and Cyto-oxBFP 62 cells). Error bars signify s.e.m. for data collected from three experimental replicates.