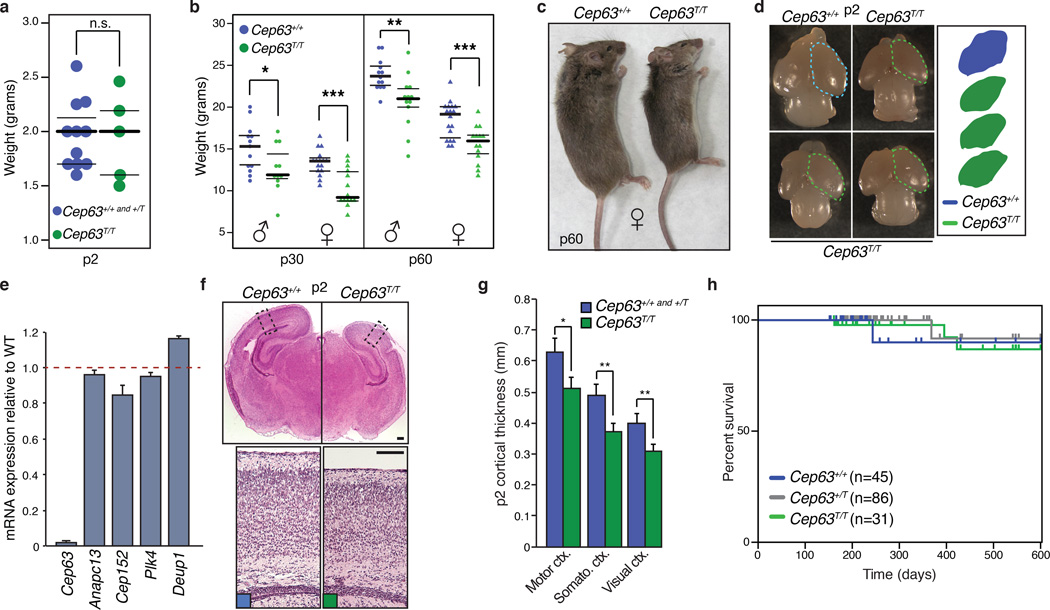
Figure 1. Cep63 deficiency leads to growth defects and microcephaly.
(a) Weights of newborn mice (p2) of the indicated genotype (Cep63+/+, +/T n = 11, Cep63T/T n = 5 pups). (b) Weight of p30 and p60 mice of the indicated sex and genotype (n = 13, 11, 16, 14, 13, 13, 18, 14 animals, respectively). (c) Examples of female littermate Cep63+/+and Cep63T/Tmice at p60. (d) Examples of p2 dissected brains of the indicated genotype with the relative cerebral cortex area compared. (e) Quantitative real-time PCR of the indicated genes using cDNA prepared from the cortex of p2 animals. Levels of mRNA expression relative to WT littermates is graphed using B2M and ACTB as a reference. (n=3 animals per genotype). (f) H&E stained coronal sections of Cep63+/+and Cep63T/T cortices from p2 animals with approximate area of higher magnification indicated (top panels). Higher magnification panels of the motor cortex stained with H&E (bottom panels, scale bar = 0.2 mm). (g) Quantification of p2 cortical thickness from the indicated genotypes and area (2 hemispheres per brain section were averaged, n = 3 animals is graphed). (h) Kaplan-Meier curve of mouse survival. No significant differences (Log-rank test) were observed over 600 days. The number of animals per genotype is indicated. In panels 1a and 1b, the median (thick line) with the 1st and 3rd quartiles of the boxplot (thin lines) are indicated. In 1e and 1g graphics with error bars represent the average plus standard deviation. Asterisks denote statistical significance (n.s.= not significant, * = p-value <0.05, ** = p-value < 0.01, *** = p-value < 0.001) determined by the unpaired two-way Student’s T-test (1a, 1g) or the unpaired two-way Wilcoxon rank sum test (1b).

