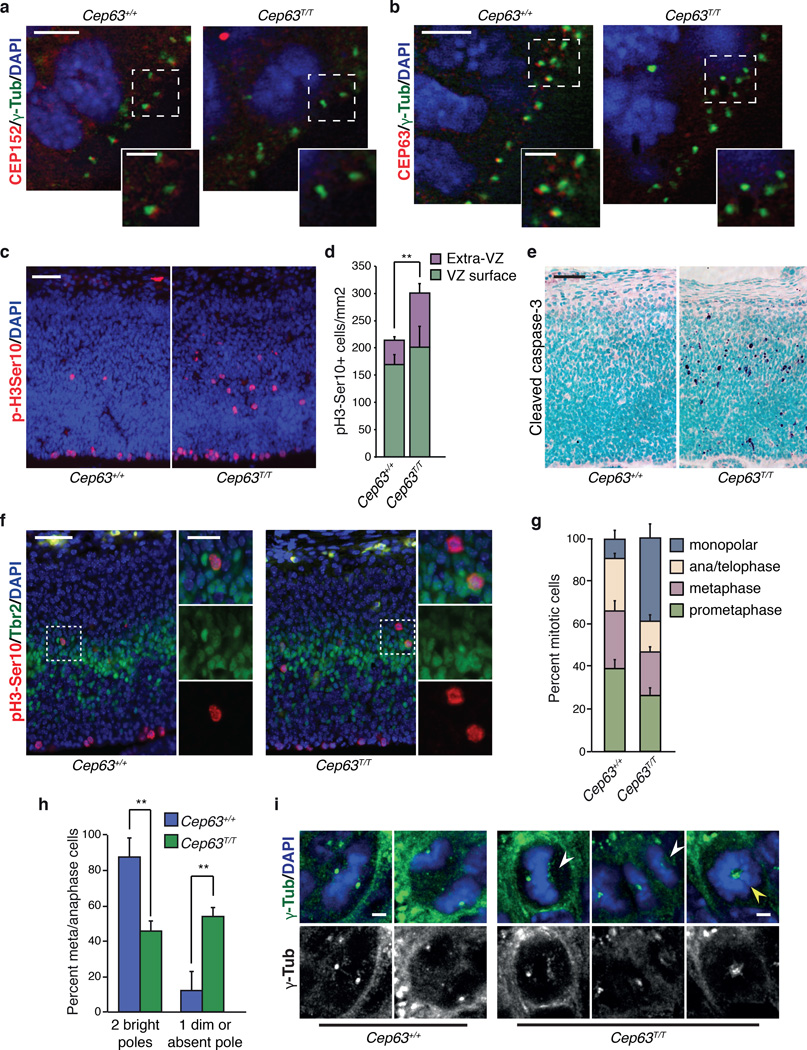
Figure 2. Impaired CEP152 localization and mitotic defects in Cep63 deficient brains.
(a) CEP152 is detectable at centrosomes, marked by γ-tubulin, in the cortex of WT (left panel) but not Cep63T/T (right panel) E14.5 embryos (scale bars represent 5 µm (left) and 2 µm (right)). (b) CEP63 is detectable at centrosomes, marked by γ-tubulin, in the cortex of WT (left panel) but not Cep63T/T E14.5 embryos (right panel). (scale bars represent 5 µm (left) and 2µm (right)). (c) Increased number and defective localization of mitotic cells (positive for p-H3Ser10) in the E14.5 cortex of Cep63T/T embryos (right panel) compared to WT (left panel). (scale bar = 50 µm). (d) Quantification of VZ surface and extra-VZ p-H3Ser10 positive mitoses in the indicated genotype (n = 5 and 3 animals per genotype, respectively). (e) Increased cleaved caspase-3 staining indicates increased cell death in the cortex of Cep63T/T embryos at E14.5 (right panel) compared to WT (left panel). (scale bar = 50 µm). (f) Some misplaced mitotic cells in the Cep63T/T cortex are intermediate progenitors (IPs) identified by positivity for Tbr2 (scale bars represent 50 µm (left) and 20 µm (right)). (g) Scoring of mitotic configurations in the E14.5 VZ. Categories and genotypes are indicated (n = 3 animals per genotype used, 102 Cep63+/+ and 150 Cep63T/T cells scored). (h) Scoring of γ-tubulin foci in metaphase and anaphase cells in VZ of E14.5 brain cortex. Mitotic cells were identified by staining sections with DAPI (DNA) and γ-tubulin (centrosome) and scored by morphology and γ-tubulin spot numbers (n = 3 animals per genotype used, 64 Cep63+/+ and 62 Cep63T/T cells scored). (i) Example images of acentrosomal (white arrowheads) and monopolar (yellow arrowhead) mitoses in Cep63T/T embryos (scale bar = 2 µm). All graphics with error bars are presented as the average plus standard deviation. Asterisks denote statistical significance (n.s.= not significant, * = p-value <0.05, ** = p-value < 0.01, *** = p-value < 0.001) determined by the unpaired two-way Student’s T-test (2d and 2h).

