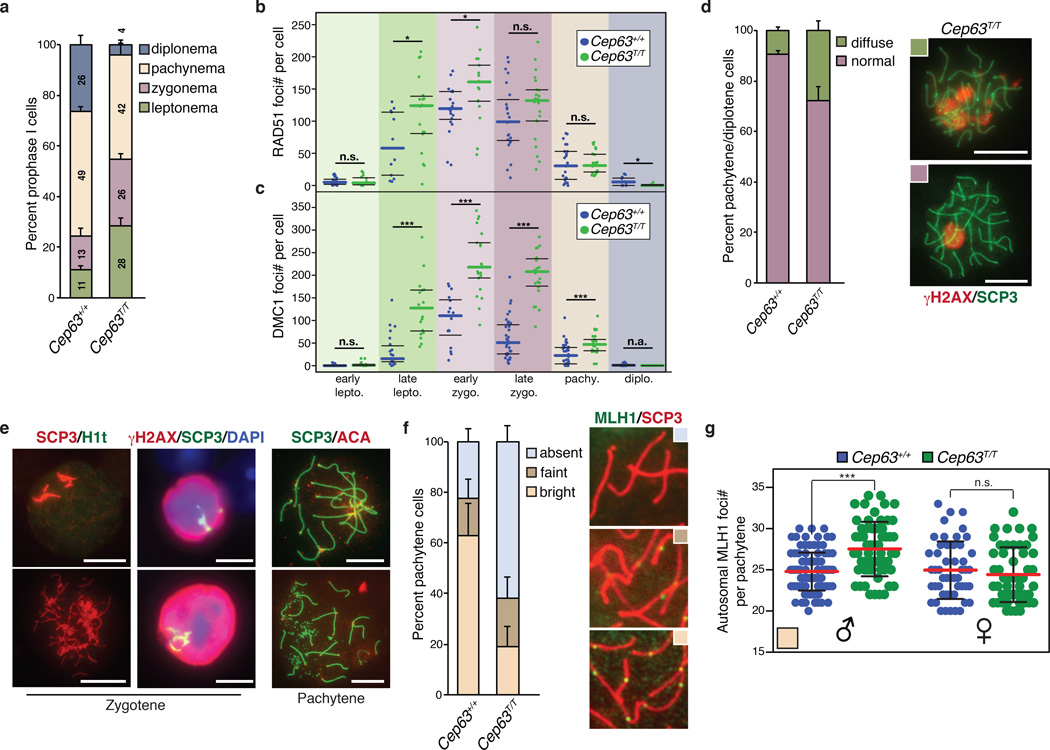
Figure 5. Impaired meiotic progression in Cep63T/T mice.
(a) Quantification of prophase I stages in meiotic cells of the indicated genotype based on co-staining of SCP1 and SCP3 (n = 3 animals per genotype used, 289 Cep63+/+ and 301 Cep63T/T cells scored). Quantification of RAD51 (b) and DMC1 (c) foci in the indicated stages of prophase I (assessed by SCP3 staining) from the indicated genotypes (Cep63+/+ n = 112 and 157, Cep63T/T n = 122 and 108 cells scored, respectively). (d) Quantification of γH2AX staining patterns in pachytene and diplotene cells (n = 3 animals per genotype used, 124 Cep63+/+ and 97 Cep63T/T cells scored), example spermatocyte spreads shown (scale bar = 10 µm). (e) Examples of aberrant SC structures observed in zygotene and pachytene spermatocytes from Cep63T/T spreads (scale bar = 10 µm). (f) Quantification of crossover formation using MLH1 staining. Reduced numbers of Cep63T/T pachytene cells have visible MLH1 foci (n = 3 animals per genotype used, 84 and 59 cells scored respectively). Examples of categories scored are shown right panels. (g) Scoring of MLH1 foci in pachytene cells with visible MLH1 foci. In the low percentage of Cep63T/T males that have visible foci, there is a significant increase in foci number (n=101 and 135 cells scored). MLH1 foci in females is comparable regardless of genotype (Cep63+/+ or +/− n = 2(M)/2(F) and Cep63T/T n = 3(M)/2(F) animals). Individual values are shown in a scatterplot with the average (red line) and standard deviation (black lines) indicated. All graphs with error bars are presented as the average plus standard deviation. Asterisks denote statistical significance (n.s.= not significant, * = p-value <0.05, ** = p-value < 0.01, *** = p-value < 0.001) determined by the unpaired two-way Wilcoxon rank sum test (4g).

