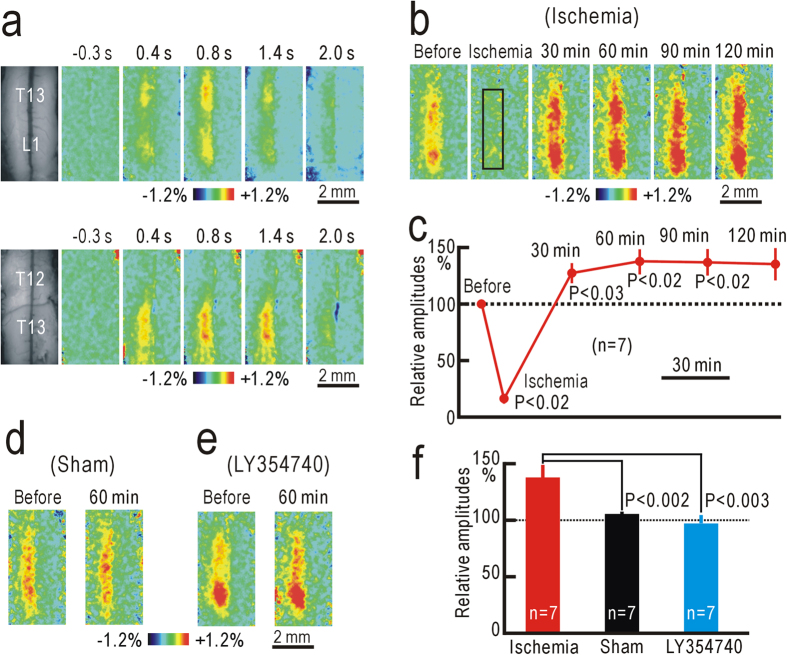
Figure 2. Potentiation of the spinal responses after hindpaw ischemia.
(a) Example of ipsilateral spinal responses elicited by vibratory stimulation applied to the left hindpaw at T13 and L1 level (upper panels). The left-most panels are original fluorescence images, and others are pseudocolor images of response magnitudes in ΔF/F0 recorded at the time before and after the stimulus onset shown on each image. Another example of ipsilateral spinal responses elicited by vibratory stimulation applied to the left hindpaw at T12 and T13 level (lower panels). (b) Example of spinal responses recorded in the same mouse before, during, and 30–120 min after ischemic treatment applied to the left thigh for 30 min. The response amplitudes were measured in the square window of 100 × 25 pixels shown in the second panel. (c) Relative amplitudes of spinal responses during and after ischemic treatment. The amplitudes were normalized by those recorded before hindpaw ischemia. (d) Example of spinal responses recorded before and at 60 min after sham treatment. (e) Example of spinal responses recorded before and at 60 min after hindpaw ischemia in a mouse with spinal application of 10 nM LY354740. (f) Comparison of the normalized response amplitudes in mice at 60 min after hindpaw ischemia, sham treatment, or hindpaw ischemia with spinal application of 10 nM LY354740.

