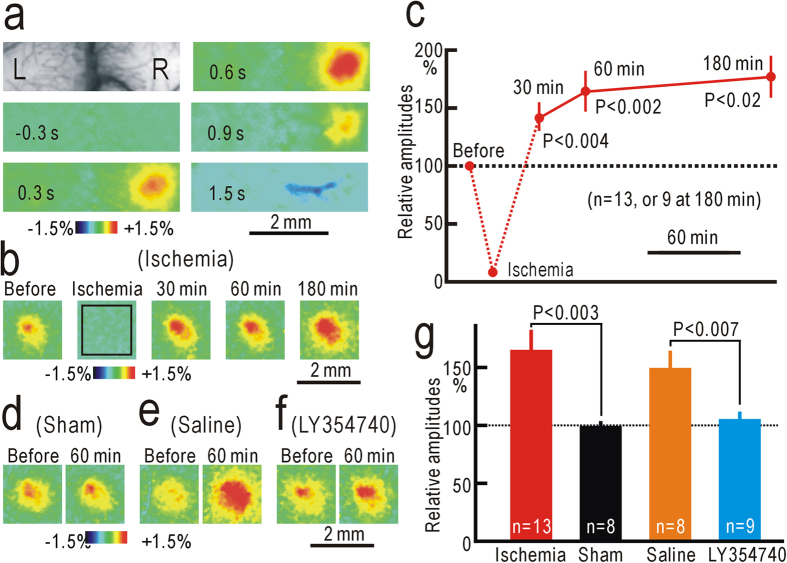
Figure 3. Potentiation of the S1 responses after ischemic treatment.
(a) Example of contralateral S1 responses elicited by vibratory stimulation applied to the left hindpaw. (b) Example of S1 responses recorded in the same mouse before, during, and 30–180 min after ischemia applied to the left thigh for 30 min. The response amplitudes were measured in the square window of 60 × 60 pixels shown in the second panel. (c) Relative amplitudes of S1 responses during and after hindpaw ischemia. (d) Example of S1 responses recorded before and at 60 min after sham treatment. (e) Example of S1 responses recorded before and at 60 min after hindpaw ischemia in a mouse with spinal application of saline alone. (f) Example of S1 responses recorded before and at 60 min after hindpaw ischemia in a mouse with spinal application of 10 nM LY354740. (g) Comparison of the normalized response amplitudes in mice at 60 min after hindpaw ischemia, sham treatment, hindpaw ischemia with spinal application of saline alone, or hindpaw ischemia with spinal application of 10 nM LY354740.

