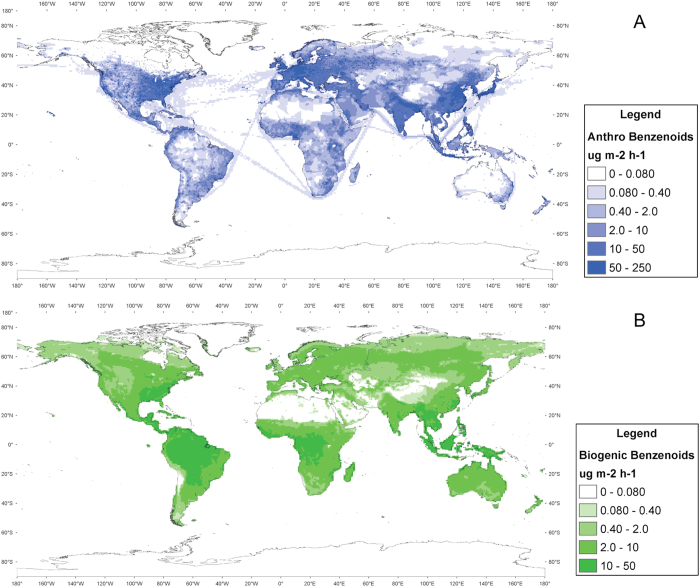
Figure 4. Spatial distributions (as annual average emissions) of anthropogenic.
(A) and biogenic (B) benzenoids. Biogenic benzenoid emissions are expected in remote areas where anthropogenic pollution (NOx) is lower so undergoes different oxidation and yields of SOA. Anthropogenic data were taken from RETRO 2000 and the biogenic distribution was calculated using MEGAN 2.1. Maps were created using ArcGIS software by ESRI (Environmental Systems Resource Institute, ArcMap 10.2, (www.esri.com)).

