Figure 3.

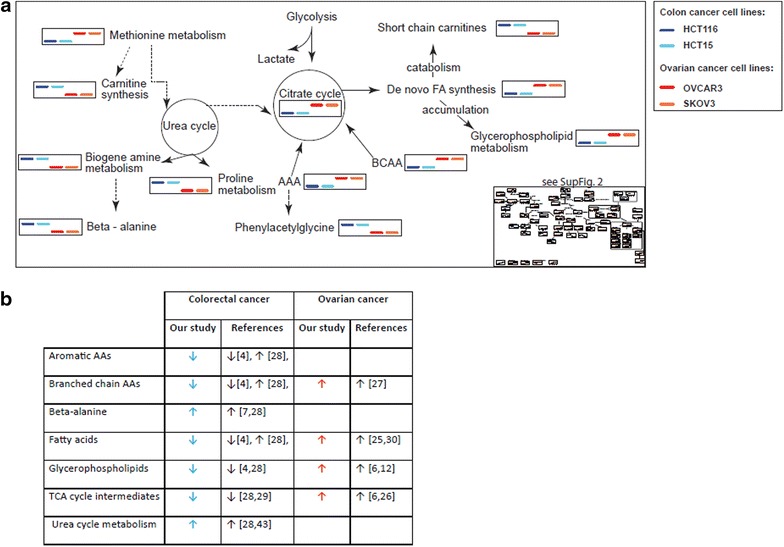
Metabolic diversity in colon and ovarian cancer cell lines. a Synthetic view of the metabolic signatures of cell lines derived from colorectal and ovarian cancers. The full data presentation is available in Additional file 7: Figure S4 as box plots in a zoomable format. The blue color gradation represents colon cancer cell lines (HCT15, dark blue; HCT116, light blue), red and orange indicate ovarian cancer cell lines (OVCAR3, red; SKOV3, orange). b Summary of the main findings of this study, as well as previously reported metabolomics changes observed in comparable human biofluids or tissue samples from patients with colon and ovarian carcinomas. Arrows indicate direction of changes reported in the literature and in the present study for colon and ovarian cancer cell lines.
