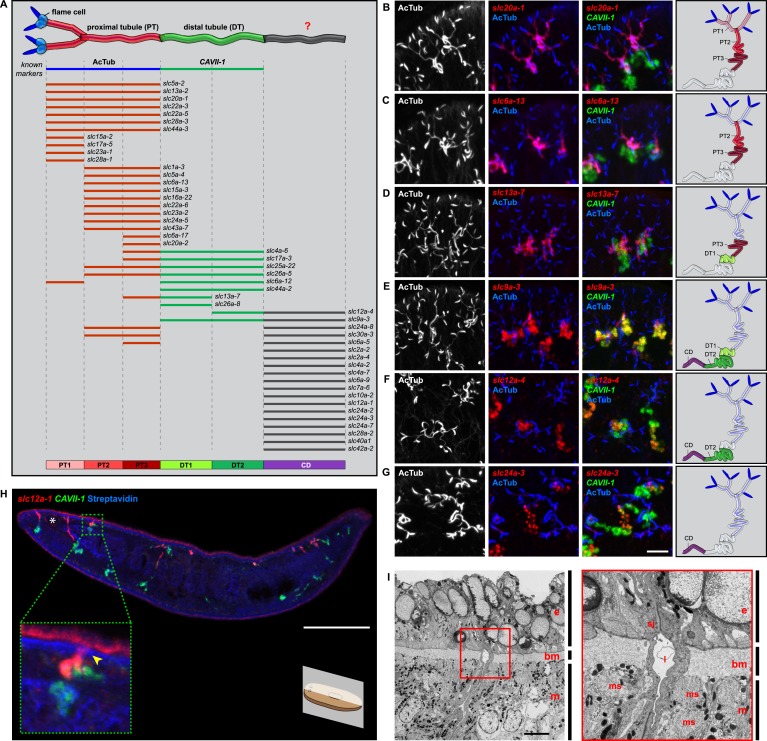
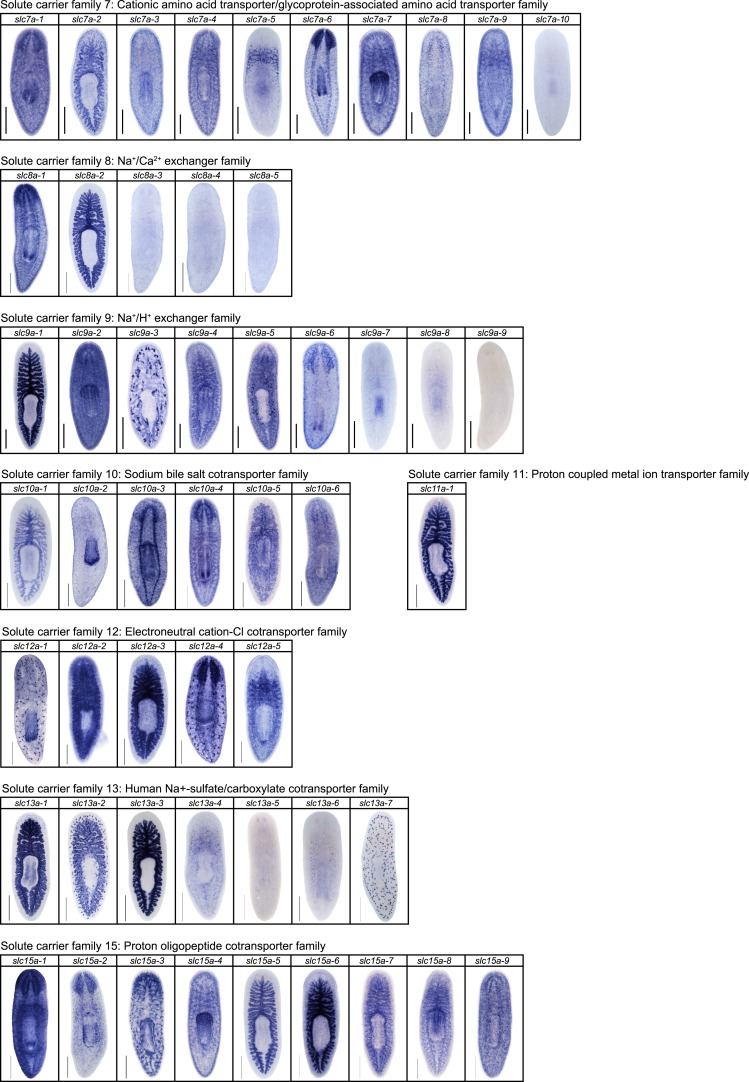
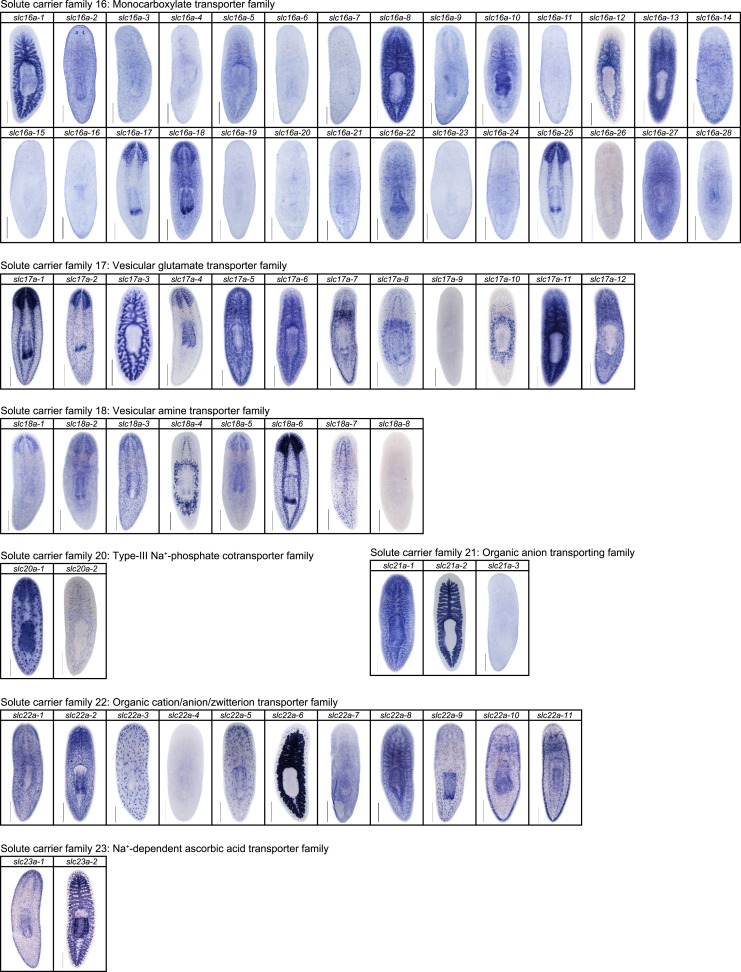
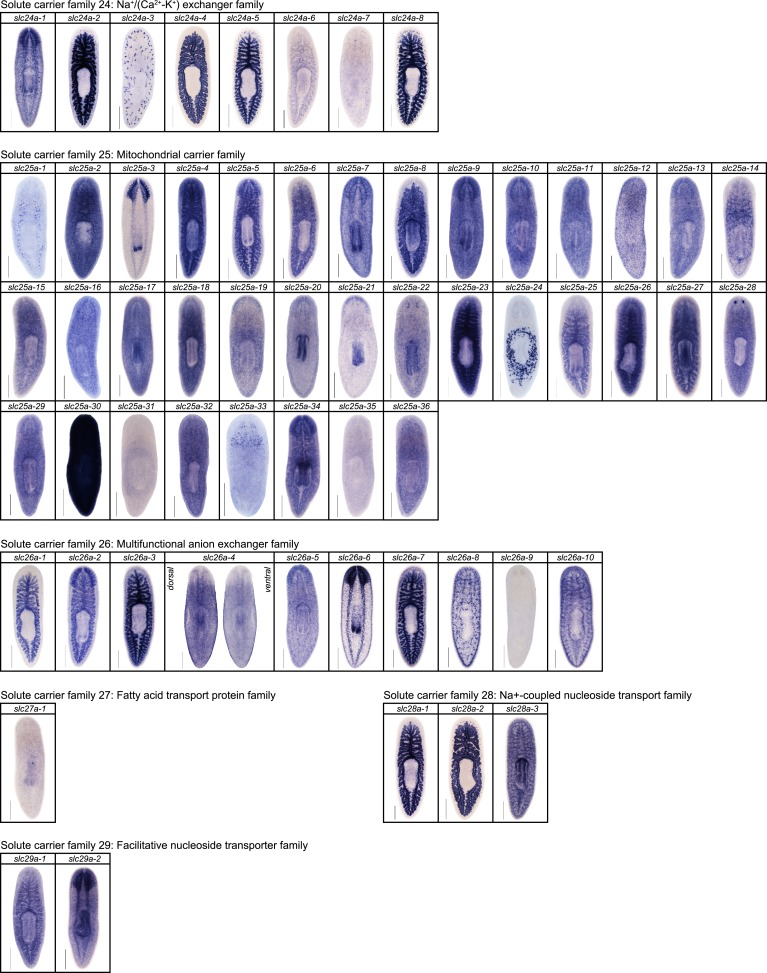
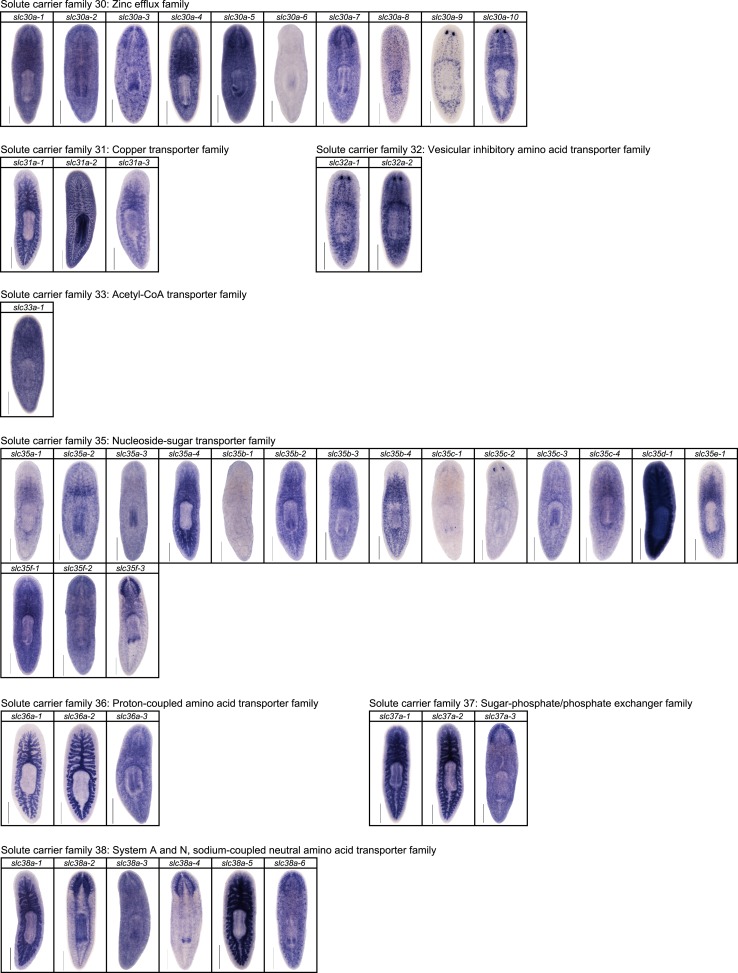
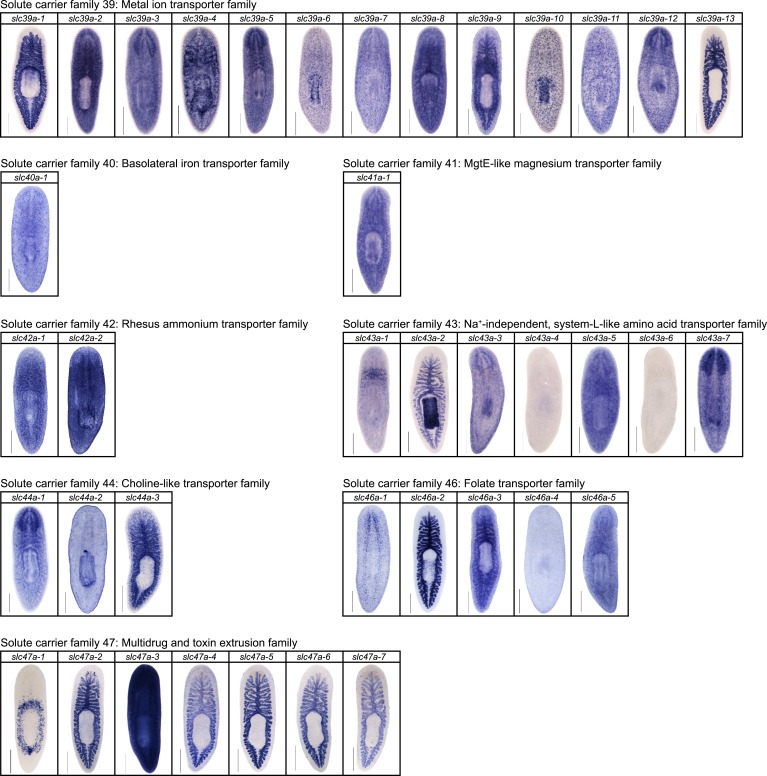
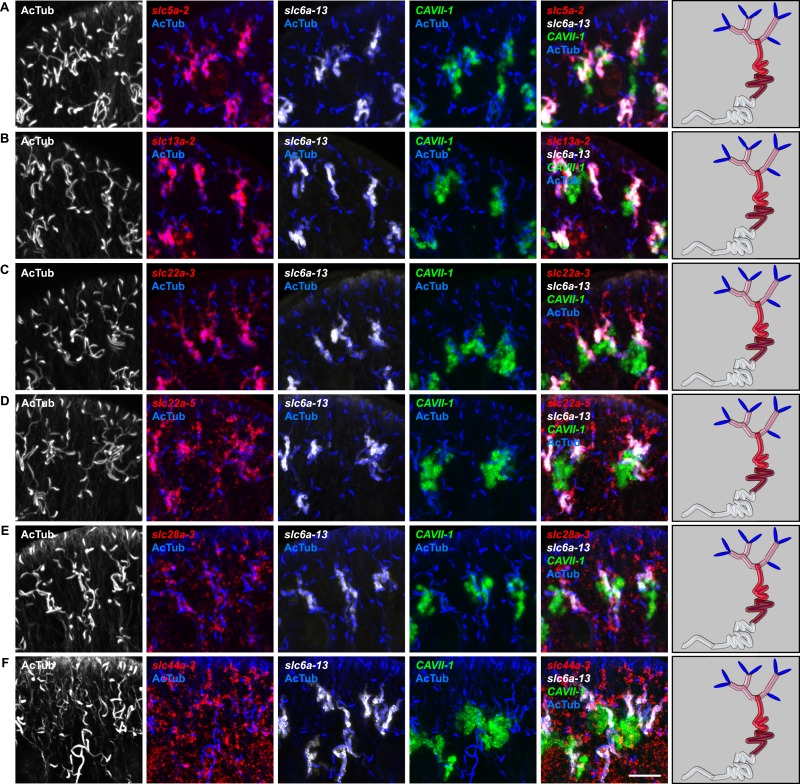
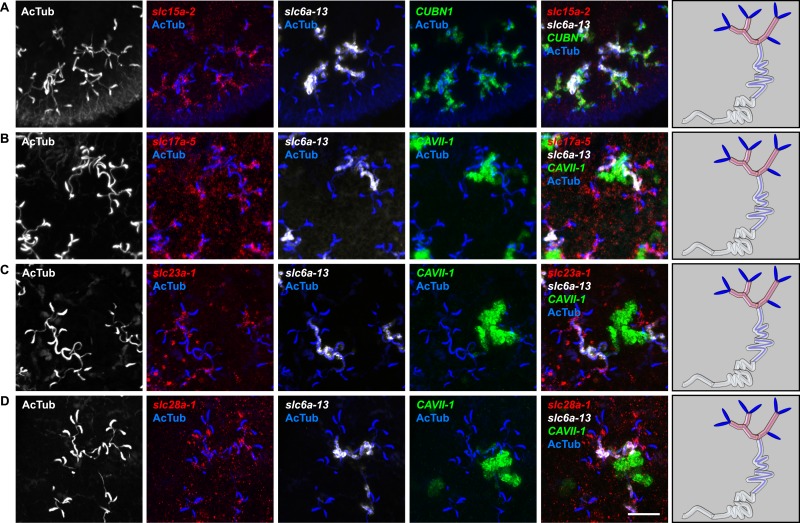
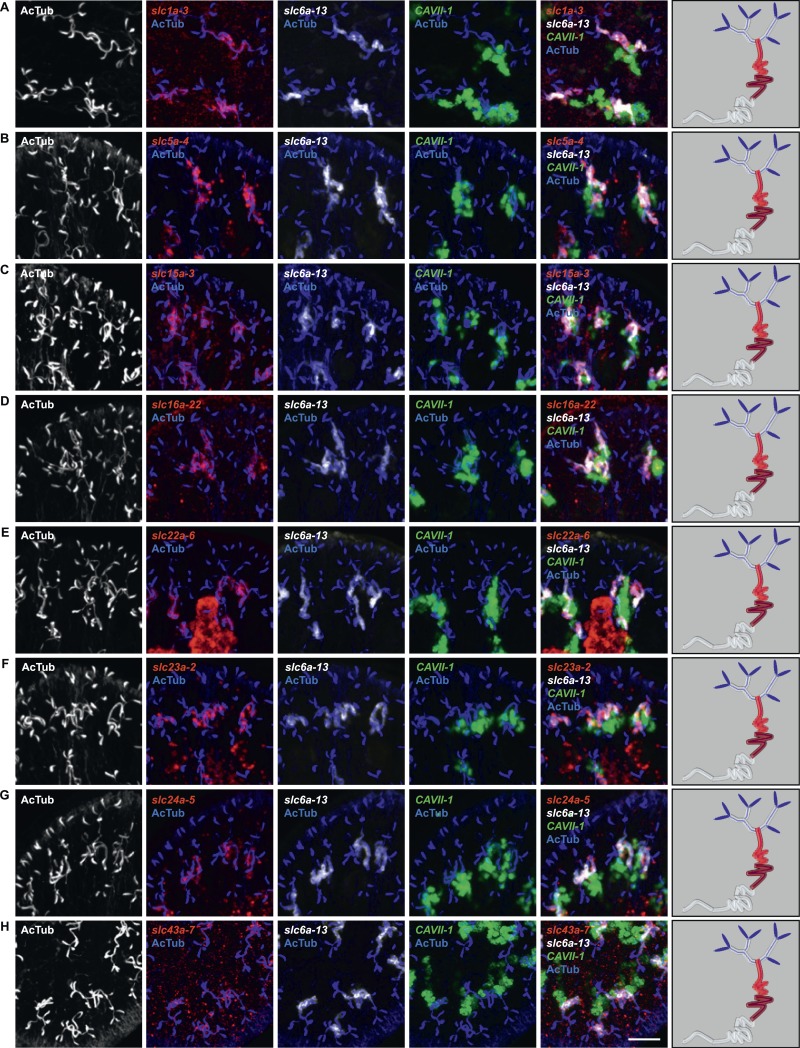
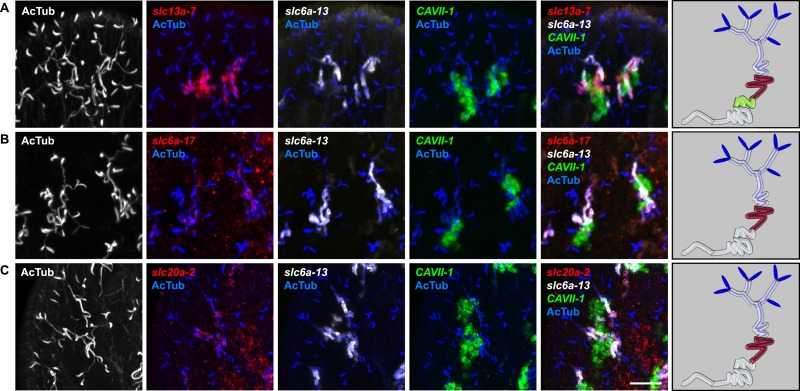
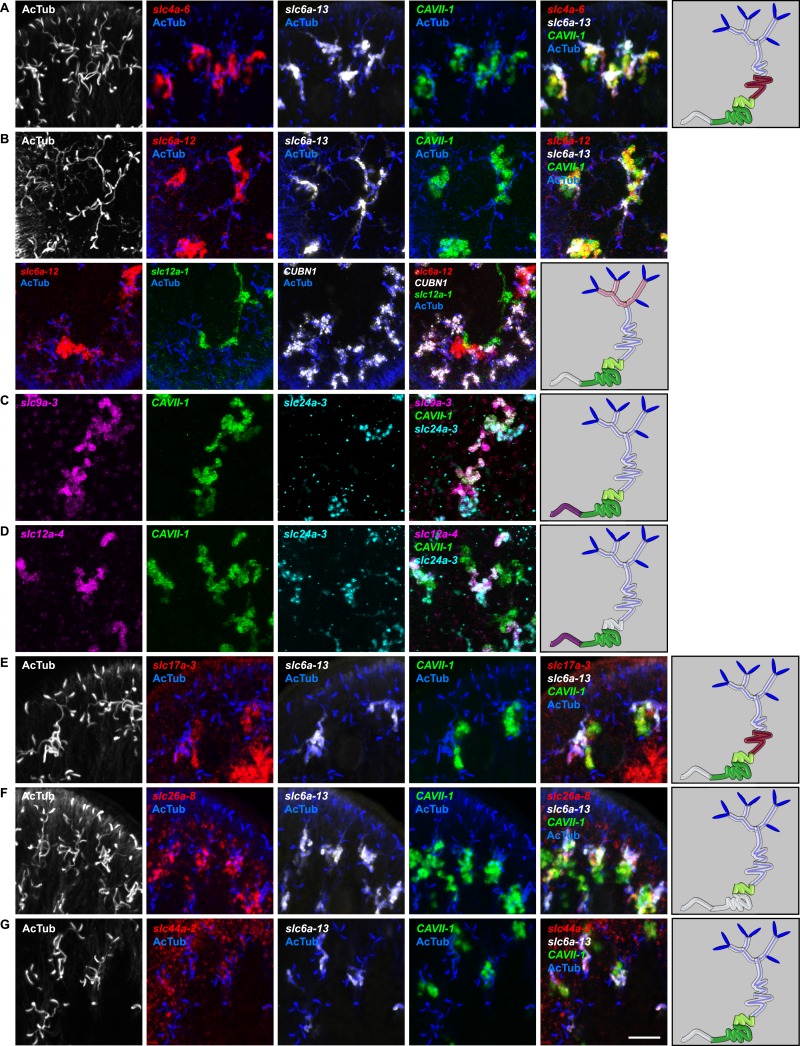
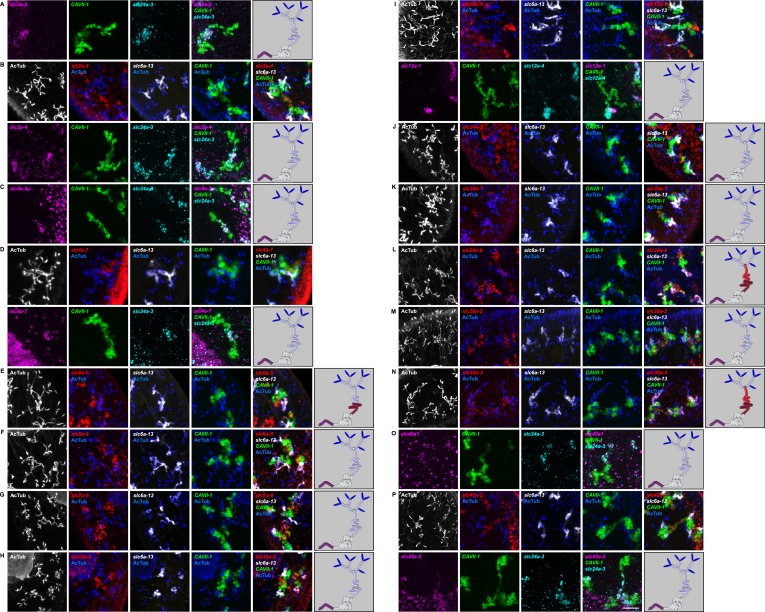
Figure 2. Unexpected complexity of protonephridial tubules is revealed by systematic gene expression mapping of slc genes along the protonephridial tubules.
(A) Cartoon shows previous segmentation model of the protonephridial tubule and expression map of slc genes along the protonephridial tubule. (B–G) Representative images show expression domains of selected slc genes in (B) PT1, PT2 and PT3, (C) PT2 and PT3, (D) PT3, (E) DT1, DT2 and CD, (F) DT2 and CD and (G) CD. Fluorescent overlay of the indicated gene (red) with PT marker (AcTub) and distal tubule (DT) marker (CAVII-1). A color-coded scheme of the protonephridial tubule at the end of each panel represents the expression domain of the indicated gene. Images are maximum projections of confocal Z-sections. Scale bars: 50 μm. (H) Longitudinal-section through a worm shows a dorsal-bias expression of slc12a-1. Fluorescent overlay of slc12a-1 with DT marker (CAVII-1) and streptavidin (which labels the basement membrane of several planarian epithelial structures, including the outer epithelium). Inset shows a magnification of CD, visualized by slc12a-1, crossing the basement membrane of the dorsal epithelia. Yellow arrowhead, exterior opening of the CD. Scale bars: 200 μm. (I) TEM image shows CD connected to the dorsal epithelia. Inset shows a magnification of CD connected to the dorsal epithelia. e, epithelia; bm, basement membrane; m, mesenchyme; sj, septate junction; l, lumen; ms, muscle. Scale bars: 5 μm.

