. 2015 Jun 9;4:e07405. doi: 10.7554/eLife.07405

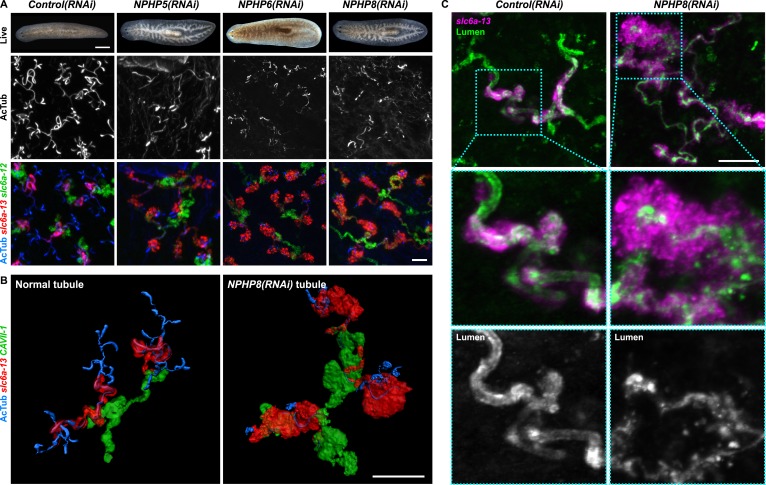
Figure 5. Down-regulation of nephrocystin members leads to the formation of cyst-like structure in protonephridia.

(A) Protonephridial defects in NPHP5(RNAi), NPHP6(RNAi) and NPHP8(RNAi) animals. Top panel: live images show edema in intact RNAi animals. Scale bars: 500 μm; middle panel: monochrome showing AcTub staining; bottom panel: fluorescent overlay of AcTub staining with PT2 and PT3 marker (slc6a-13) and DT marker (slc6a-12). Scale bars: 50 μm. (B) 3D rendering images showing normal tubule and cystic-like tubule in Control(RNAi) and NPHP8(RNAi) animals, respectively. 3D rendering was performed in IMARIS. Scale bars: 50 μm. (C) Fragmented lumen in enlarged protonephridial tubule. Fluorescent overlay of PT2 and PT3 marker slc6a-13 and lumen marker (a customized rabbit antiserum recognized unknown epitope) in intact Control(RNAi) and NPHP8(RNAi) animals. Scale bars: 50 μm. Images in (A) and (C) are maximum projections of confocal Z-sections.

DOI: http://dx.doi.org/10.7554/eLife.07405.033

Figure 5.

Figure 5—figure supplement 1. Nephrocystins in the planarian S. mediterranea.

Figure 5—figure supplement 1.

(A) Homology analysis of planarian nephrocystins. Domains predicted by SMART for planarian and human proteins. Best reciprocal BLAST hits in human, C. elegans, and fly refseq protein database. (B) Whole-mount expression patterns of genes encoding nephrocystins by in situ hybridization. Scale bars: 500 μm.
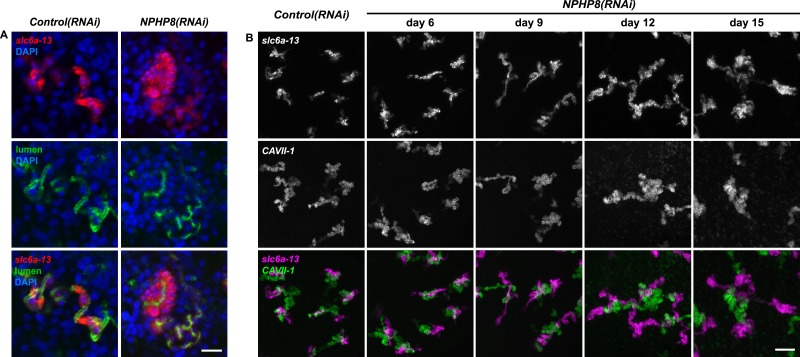
Figure 5—figure supplement 2. Abnormal tubular enlargement in NPHP8(RNAi) animals.

Figure 5—figure supplement 2.

(A) Fluorescent overlay of lumen marker with PT2 and PT3 marker slc6a-13 and nuclei (DAPI) in Control(RNAi) and NPHP8(RNAi) animals. Scale bars: 25 μm. (A) Fluorescent overlay of PT marker (slc6a-13) and (B) DT marker (CAVII-1) in intact Control(RNAi) and NPHP8(RNAi) animals. Images are maximum projections of confocal Z-sections. Scale bars: 50 μm.
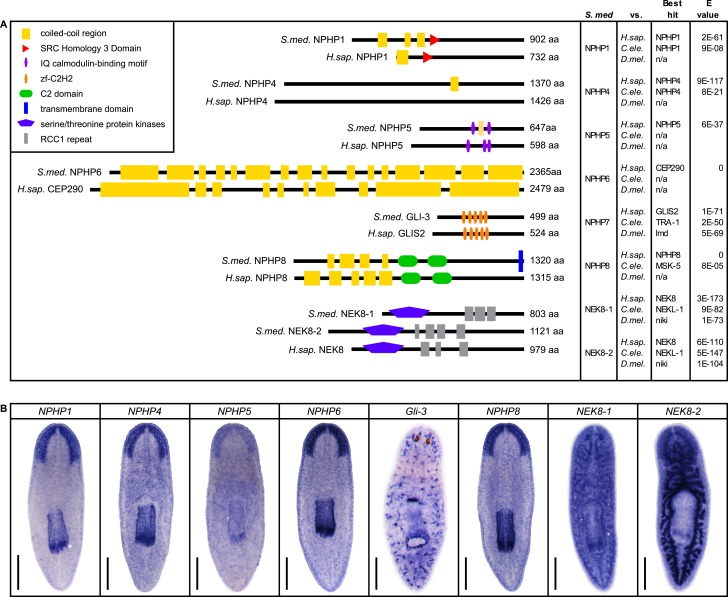
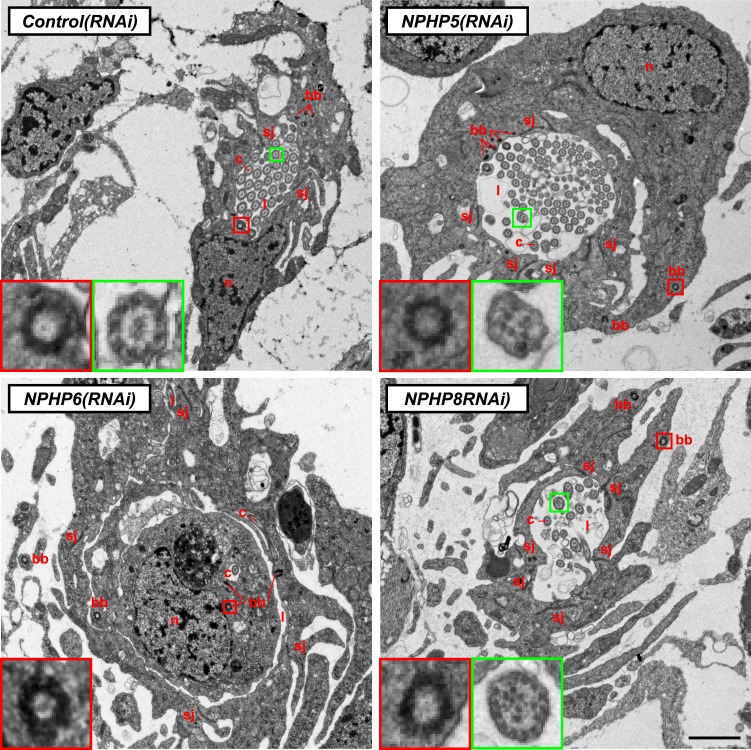
Figure 5—figure supplement 3. Ultrastructure of the PT in NPHP(RNAi) animals.

Figure 5—figure supplement 3.

TEM images showing cross-section through a tubule of protonephridia in indicated RNAi animals. Inset in red box shows abnormally localized basal body in indicated RNAi animals. Inset in green box shows ultrastructure of cilia. c, cilia; n, nucleus; bb, basal body; sj, septate junction; l, lumen.