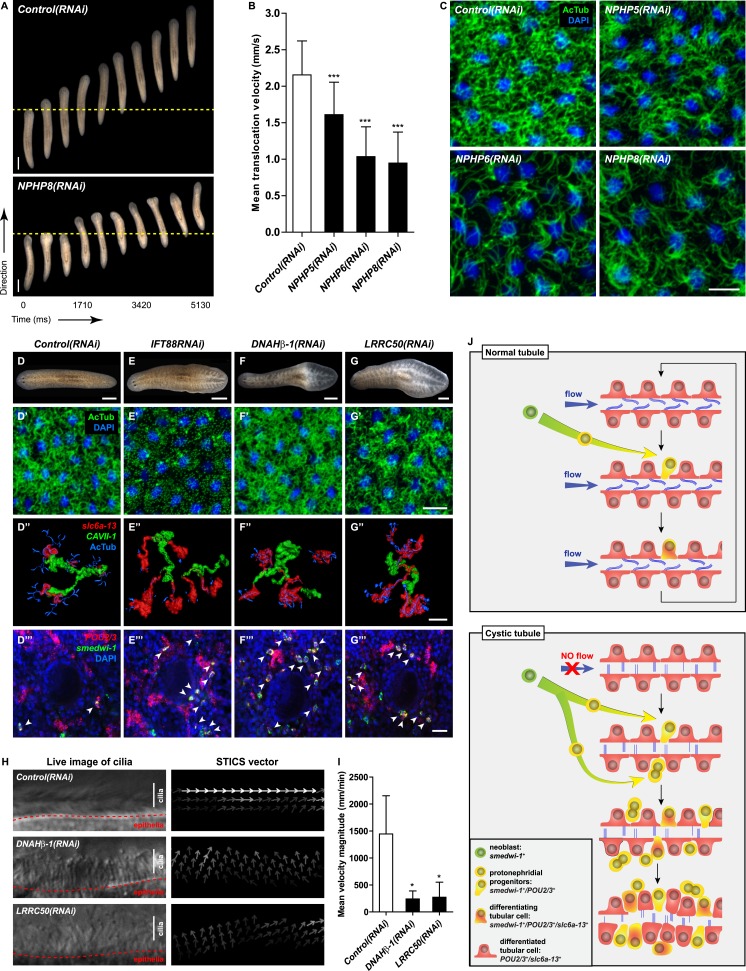
Figure 7. Cystic phenotype in protonephridia is cilia-and fluid flow-dependent.
(A) Series of live images show gliding mobility in Control(RNAi) and NPHP8(RNAi) animals. Yellow dot line provides a spatial reference to illustrate progress of animal. Scale bar: 1 mm. (B) Quantification of translocation speed in indicated RNAi animals. Error bar, SD; *** p < 0.001 vs control. (C) Fluorescent overlay of ventral cilia (AcTub) with nucleus marker (DAPI) in indicated RNAi animals. Scale bar: 10 μm. (D–G) Live images show bloating phenotype in IFT88(RNAi), DNAHβ-1(RNAi), and LRRC50(RNAi) animals. Scale bar: 500 μm. (D′–G′) Fluorescent overlay of ventral cilia (AcTub) with nucleus marker (DAPI) in IFT88(RNAi), DNAHβ-1(RNAi), and LRRC50(RNAi) animals. Scale bar: 10 μm. (D′′–G′′) 3D rendering showing fluorescent overlay of AcTub staining with PT2 and PT3 marker (slc6a-13) and DT marker (CAVII-1) in Control(RNAi), IFT88(RNAi), DNAHβ-1(RNAi), and LRRC50(RNAi) animals. Scale bar: 50 μm. (D′′′–G′′′) Magnified view shows fluorescent overlay of POU2/3 with pan stem cell marker (smedwi-1) in the region surrounding photoreceptor. White arrowhead shows POU2/3+/smedwi-1+ cell. Scale bar: 25 μm. (H–I) Abnormal cilia beating in DNAHβ-1(RNAi), and LRRC50(RNAi) animals. (H) Left panel: live images show cilia beating along the lateral body edge of the planarian head region; Right panel: vector map generated by Spatiotemporal image correlation spectroscopy (STICS) analysis shows velocity magnitude and beating pattern of cilia. The brightness of the vector represents the velocity magnitude of the cilia: brighter vector, stronger ciliary beating or vice versa. (I) Quantification of ciliary velocity magnitude in indicated RNAi animals. * p < 0.05 vs control. (J) Cartoon represents working model of cyst formation in the planarian protonephridia. In normal tubule, protonephridial tubular cell turnover is maintained by integration of protonephridial progenitors, originated from the neoblasts, into the tubule. During this process, cilia-driven fluid flow is required for the maintenance of tubular geometry. Obstruction of fluid flow by disrupting cilia function leads to protonephridial cystogenesis that characterized by abnormal proliferation of protonephridial progenitors, tubular enlargement and disorganization.


