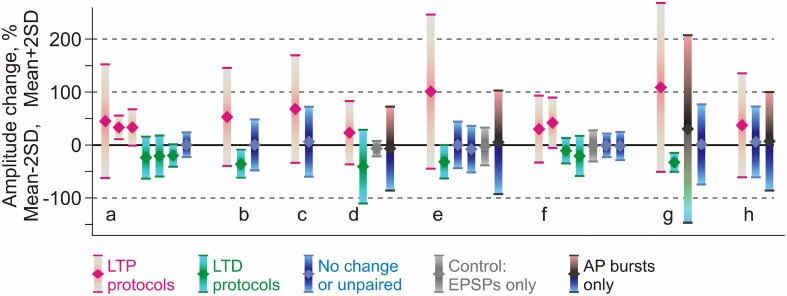
Figure 5.
Comparison of reported changes of response amplitude at inputs that were active during the induction (homosynaptic, input-specific) and those not active during the induction (heterosynaptic). The plot shows results of 36 experimental series (bars) from eight papers (groups of bars) on pairing-induced long-term plasticity (STDP), in which the mean amplitude changes were reported together with the SD (or SEM) and number of observations. Each bar shows an average (diamond symbol) change of EPSP amplitude after pairing procedure ±2 SD. This range includes 95% of normally distributed values. Magenta: changes after LTP protocols (post after pre). Green: changes after LTD protocols (pre after post). Blue: range of EPSP amplitudes after protocols that did not lead to significant changes of the averaged response (such as interval between pre and post spikes outside plasticity windows). Gray: range of EPSP amplitudes after only presynaptic stimulation without postsynaptic spikes. Black, bars from cyan to pink (in d,e,h): range of EPSP amplitudes after bursts of postsynaptic spikes only, without presynaptic stimulation. Data for excitatory inputs to L2/3 or L5 pyramidal neurons from somatosensory, visual or auditory cortex, from the following papers: Feldman (2000) (a); Sjöström et al. (2001) (b); Watt et al. (2004) (c); Birtoli and Ulrich (2004) (d); Nevian and Sakmann (2006) (e); Letzkus et al. (2006) (f); Hardingham et al. (2007) (g); Chistiakova et al. (2014) (h). Results from Hardingham et al. (2007) (g) present the LTP and LTD data selected by the direction of the change. The third bar in this group shows LTP and LTD data pooled together. Details of experimental protocols can be found in original papers. (Modified, with permission, from Chistiakova et al., 2014).

