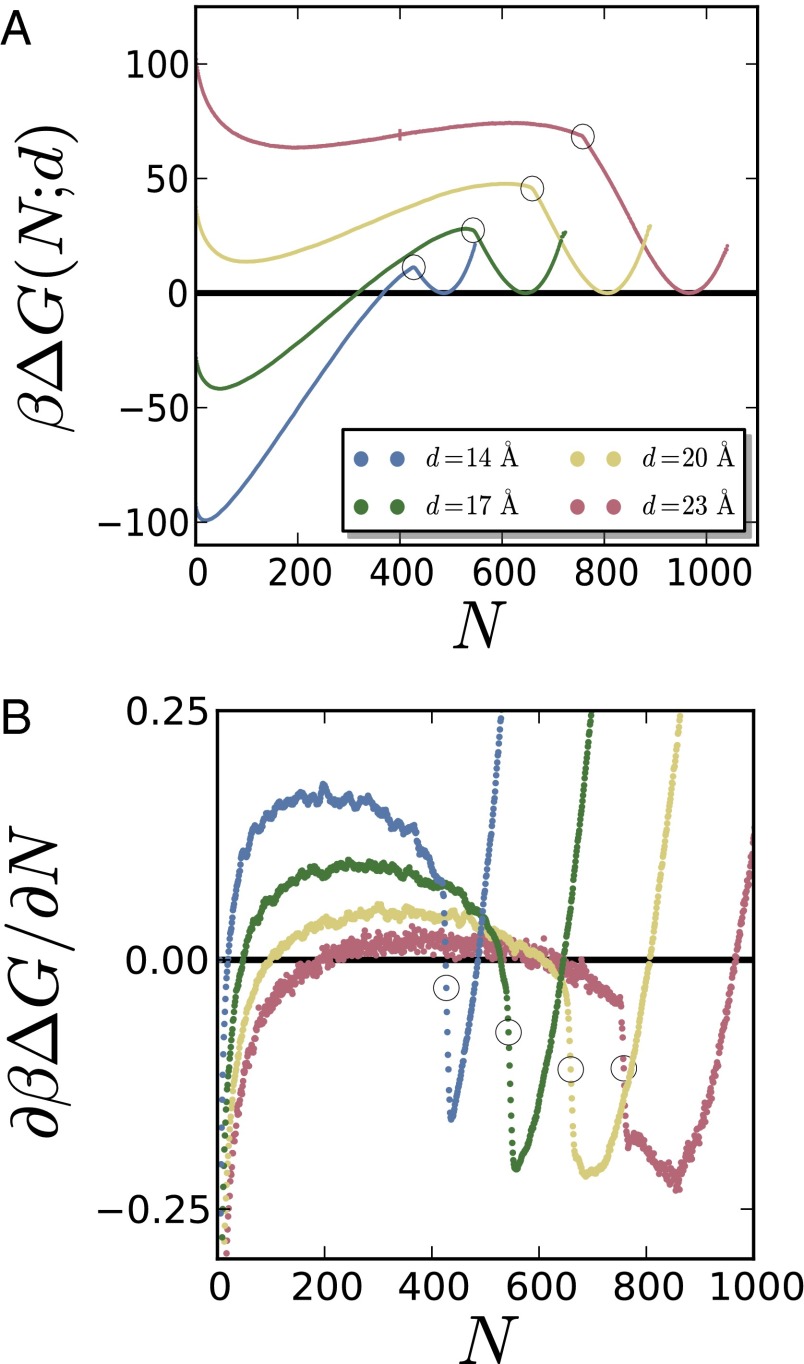
Fig. 2.
(A) The simulated free energy profiles, , as a function of the number of water molecules between the surfaces, N, display marked kinks (highlighted by circles). Here, , with being the Boltzmann constant and T being the temperature. The size of the largest error bar is also shown for Å and . (B) The kinks are also apparent in the smoothed derivatives of the free energy profiles, which display a sharp decrease in the vicinity of .

