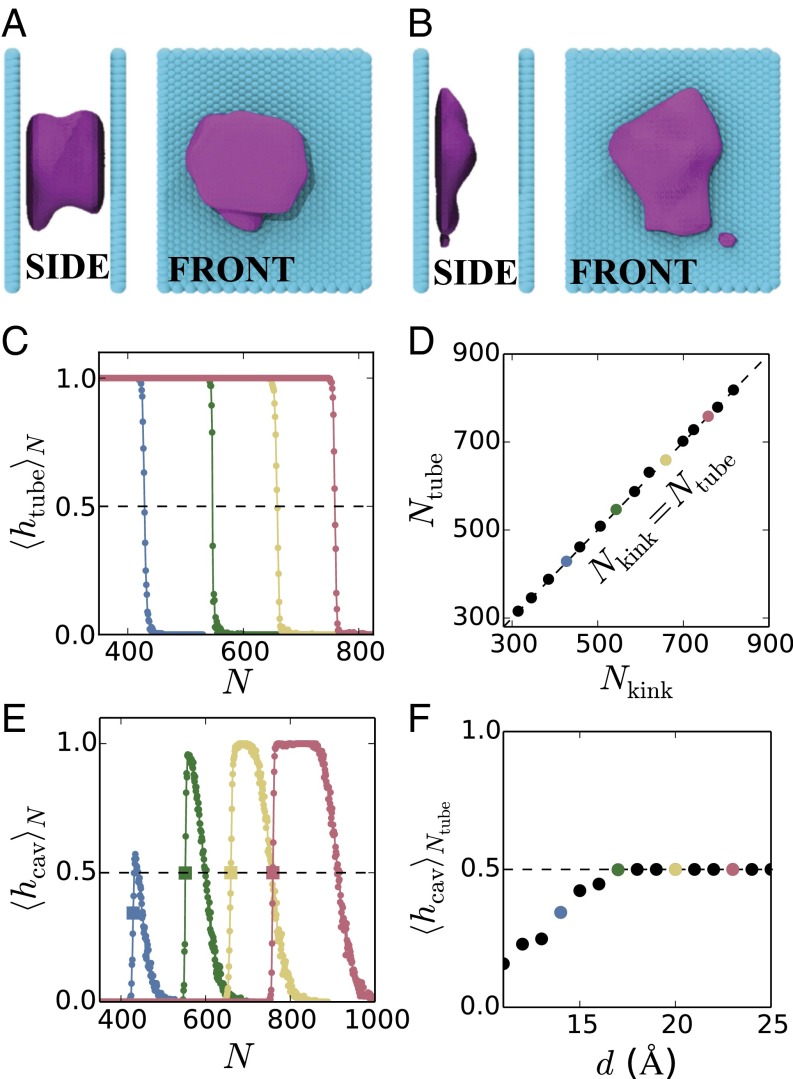
Fig. 3.
Instantaneous interfaces encompassing dewetted regions (shown in purple) between the hydrophobic surfaces (shown in cyan) separated by Å highlight the presence of (A) a vapor tube for , and (B) an isolated cavity for . Water molecules not shown for clarity. (C) Average of the binary vapor tube indicator function, , conditioned on the number of waters in confinement being N, displays a sharp transition from 1 to 0 as N is increased. The color scheme is the same as that in Fig. 2. The value of N corresponding to (dashed line) is defined as . (D) is identical to the location of the kink in the free energy profiles, , as shown by the agreement between the simulation data and a straight line (dashed). This agreement confirms that the kink demarcates conformations with and without vapor tubes. (E) Conditional average of the isolated cavity indicator function, , shows a sharp increase in the vicinity of (the square symbols correspond to ), followed by a gradual decrease at larger N values, and eventually vanishes around . (F) For the larger d values, . However, for the smaller d values, , suggesting the possibility of direct vapor tube nucleation without isolated cavities as intermediates.

