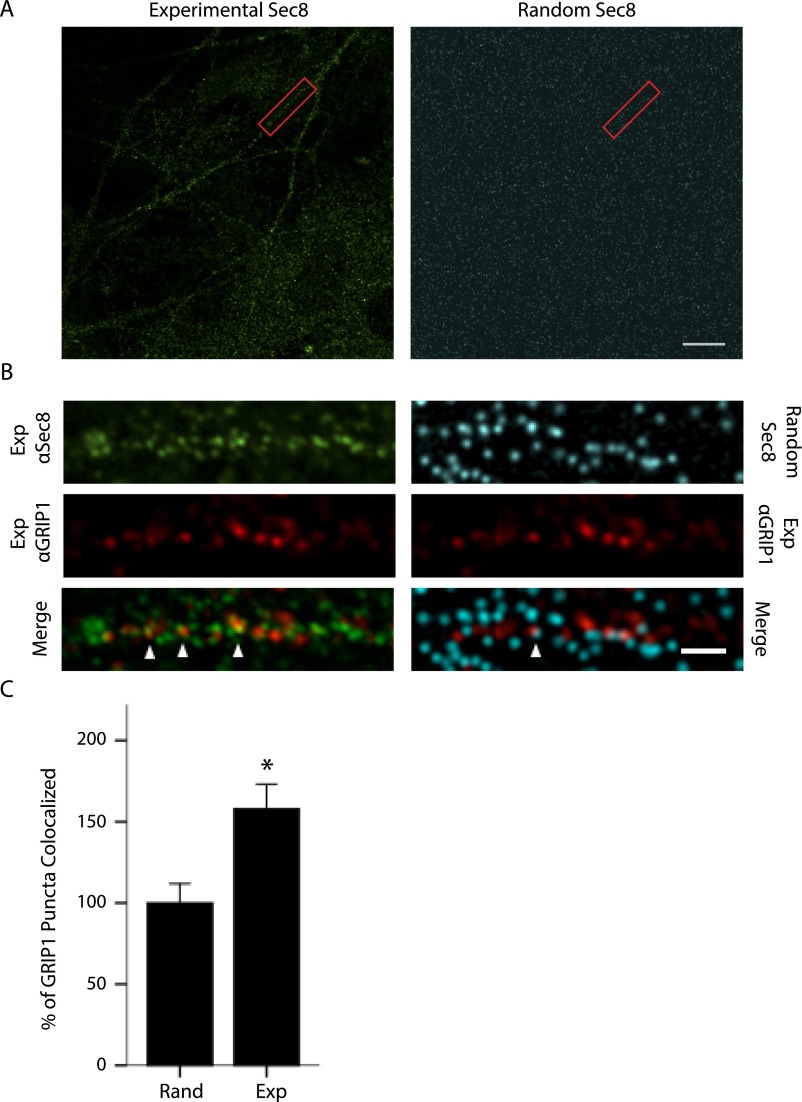
Fig. S3.
Quantification of expected random colocalization rates. (A) Example of an experimental Sec8 image (Left) and an artificially generated Sec8 image (Right), in which puncta with the same size and intensity distribution as in the real data are randomly distributed throughout the field of view. Red box designates inset for B. (Scale bar: 10 μm.) (B, Left) Representative images for Sec8 (green) and GRIP1 (red) staining, with the merge shown below. (B, Right) Artificially generated Sec8 image (blue) and real GRIP1 image (red), with merge shown below. Arrows mark sites of colocalization. (Scale bar: 2 μm.) (C) Percentage of GRIP1 puncta that were colocalized with Sec8 in the random and experimental conditions (n = 71 images). *Experiment different from random, P < 0.05.

