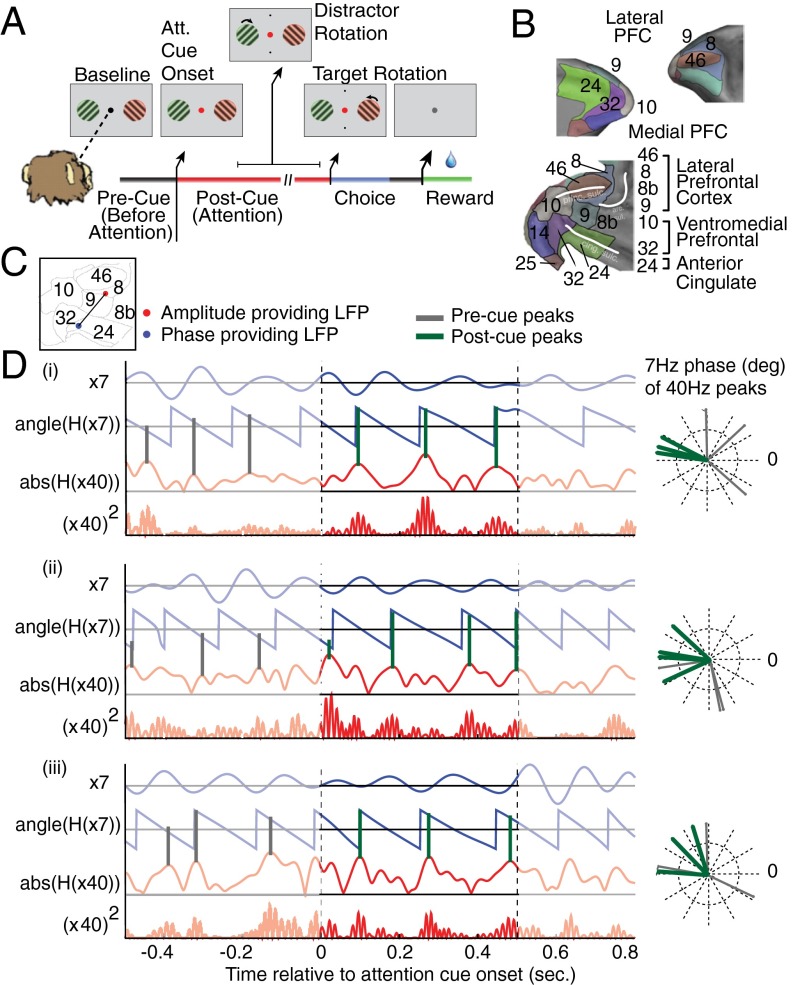
Fig. 1.
Task and illustration of example theta–gamma correlation. (A) The selective attention task required monkeys to keep fixation on a central cue throughout a trial, while presented with two peripheral grating stimuli. First, both grating stimuli changed their color simultaneously to either green or red, the location of which was random. Then, the fixation point changed its color to match the stimulus to which the monkey has to covertly shift attention. The attended stimulus rotated transiently at unpredictable times, requiring the monkey to judge a clockwise/counterclockwise rotation to receive fluid reward. Rotations of the nonattended stimulus had to be ignored (filtered). (B) Lateral and medial prefrontal cortex of macaques rendered in 3D (upper panels) and represented as 2D flat map (bottom panel) with a standard labeling of cortical fields (for details, see Fig. S1). Adapted from ref. 3. (C) Anatomical locations on the 2D flat map of an example LFP pair in which the LFP theta phase of one recording site in the ACC (blue dot) correlated with the low-gamma amplitude of a second LFP recording site in LPFC area 8 (red dot). (D) Filtered phase and amplitude traces for the example LFP–LFP pair that is shown in C for three trials (i–iii). For each trial, the bandpass-filtered low-frequency activation and its phase evolution are shown with blue lines, and the amplitude envelope and the squared gamma amplitude of the amplitude-providing LFP recording are shown in red. Gray (green) vertical lines highlight the phases at which the gamma-amplitude variations show peaks within the 500 ms before (after) attention cue onset. The polar plot on the Right shows these peak phases in the precue and postcue epoch. For this ACC–LPFC example pair, the gamma-amplitude peaks of the PFC channel correlate with similar theta phases of the ACC channel in the postcue period. For more examples, see Fig. S2.

