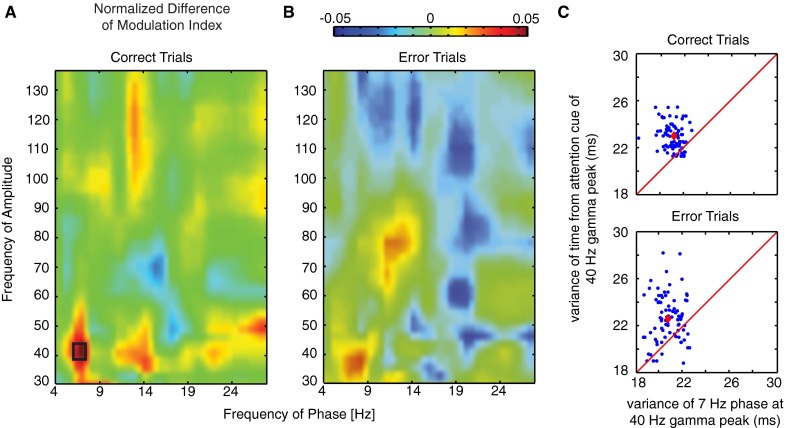
Fig. S3.
Theta–gamma correlation is significantly enhanced after attention cue onset on correct trials in a narrow theta–gamma coupling range. (A and B) Same format as Fig. 2 A and B in the main text. Comodulograms of the normalized difference in the phase (x axis)-to-amplitude (y axis) correlation (measured as MI) in the postcue relative to the precue task epoch (n = 1,104). Positive values indicate increases of P–A correlation after attention cue onset. The left and right panels shows PAC difference for correct and error trials, respectively. The black rectangle denotes significant (P < 0.05, FDR corrected) comodulation difference. (C) Scatter plot of the variance of the time from attention cue onset (y axis) and circular variance of the phase (x axis) relative to the maximum peak of the gamma envelope (n = 85). The red line denotes where variances are equal, and the red dot is defined by the average variance.

