Fig. 2.
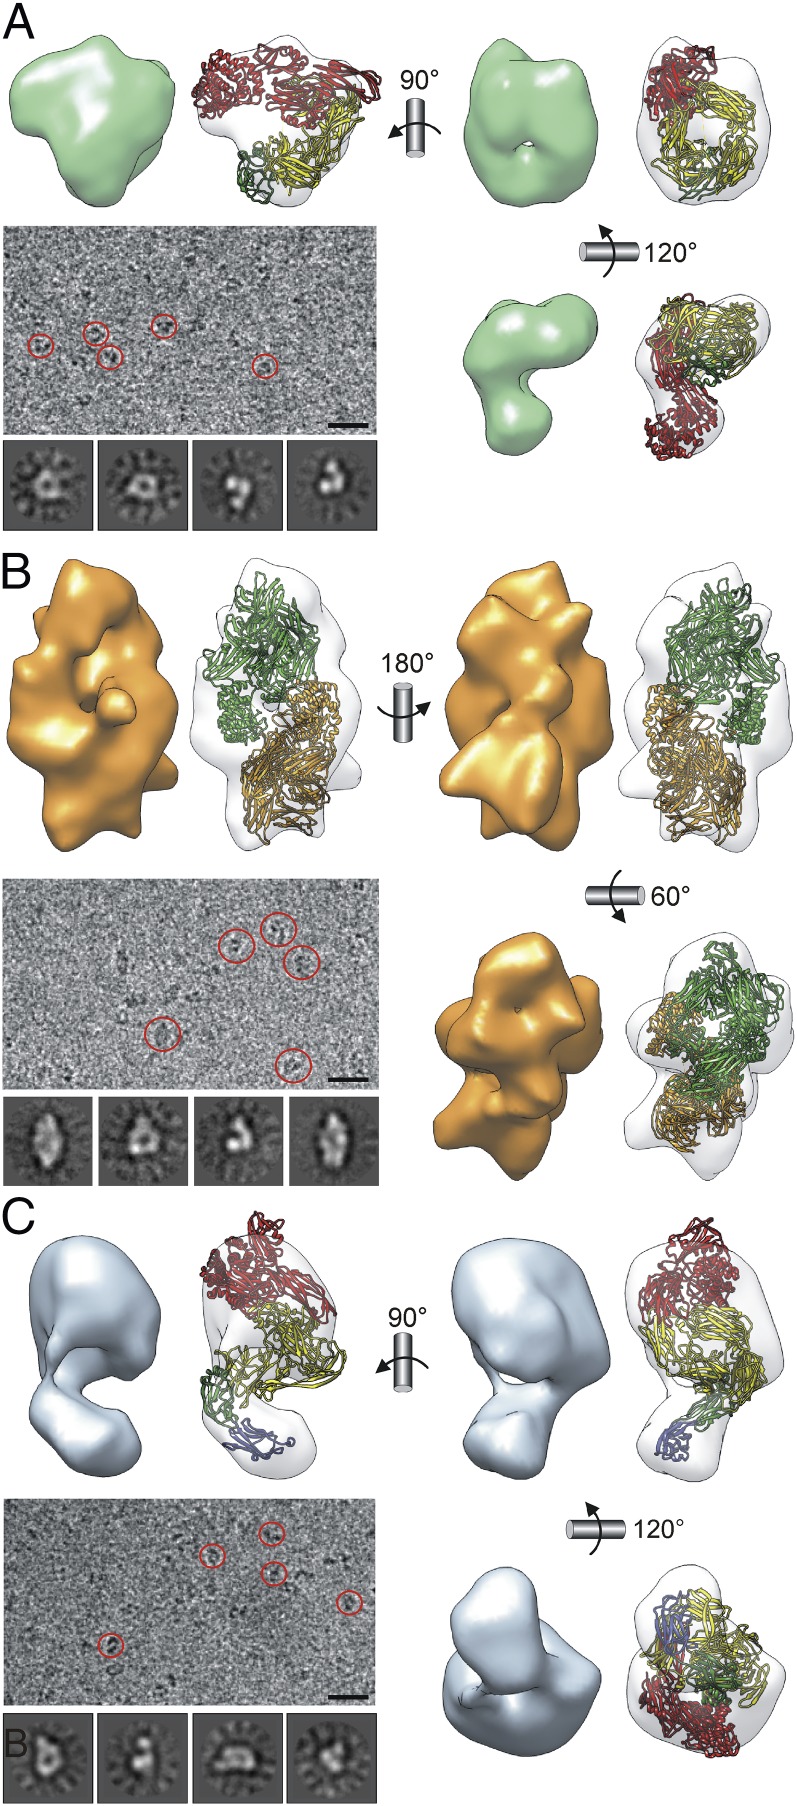
ECAM single-particle cryo-EM reconstructions. (A) Monomeric iECAM. (B) Dimeric iECAM. (C) Monomeric nECAM. In each case, the cryo-EM map (solid surface) and the fitting of the respective atomic models (semitransparent surfaces) are shown in three views. Representative cryo-EM field views are also depicted (selected particles are encircled). (Scale bar, 300 Å.) In addition, four representative averaged classes are shown. Monomeric ribbon models are depicted in four colors (MG7-CUB[TED]-RBD in red, MG1–MG6 in yellow, NIE in green, and MG0 in blue). In the dimeric model, whole monomers are in green and orange. Left orientation of A and C as in Fig. 3D. Best fitting of dimeric iECAM was achieved by rotating one molecule 19° away from the C2-symmetric position.

