Fig. 3.
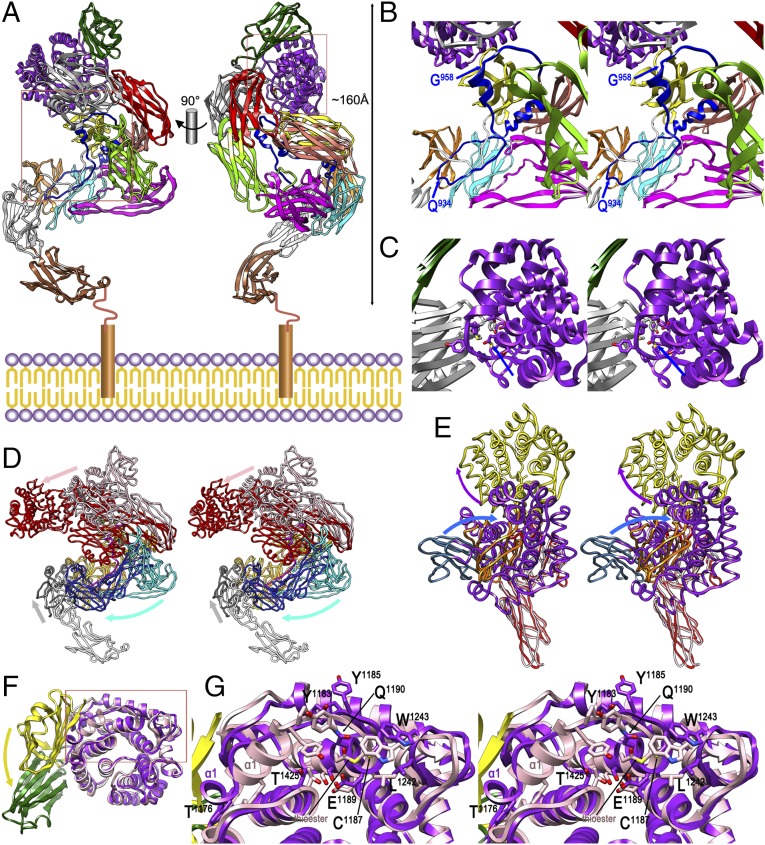
Native ECAM and transition to induced ECAM. (A) Composite homology model of full-length nECAM anchored to the inner membrane in two orthogonal views, with domains colored as in Fig. 1A. (B) Close-up in cross-eye stereo of the left rectangle of A. The suggested limits of the (modeled) bait region within BRD, based on potential accessibility, are pinpointed by blue arrows. (C) Close-up in stereo of the right rectangle of A, showing the protected intact thioester (blue arrow; see also G). (D) Structures of nECAM (as in A) and iECAM in stereo after optimal superposition of MG1-L-MG2 and MG5-MG6 (both in orange for iECAM, in yellow for nECAM). Diverging segments are MG7-CUB(TED)-RBD (iECAM, red; nECAM, pink), MG3–MG4 (iECAM, dark blue; nECAM, cyan), and MG0-NIE [iECAM (NIE only), gray; nECAM, white]. Arrows pinpoint the overall displacements on induction of the three groups in the color of the respective nECAM segments. (E) Detail in stereo of the experimental crystal structures of nECAMΔN and iECAM showing MG7 and RBD (both in red for iECAM, in pink for nECAM), CUB (iECAM, orange; nECAM, blue), and TED (iECAM, yellow; nECAM, purple). Arrows pinpoint the overall relative displacements of CUB and TED on induction in the color of the respective nECAM domains. (F) Detail of CUB-TED of the nECAMΔN (yellow-pink) and iECAM (green-purple) crystal structures after optimal superposition of the TED domains only. The CUB domain undergoes a relative 90° rotation on induction (yellow arrow). (G) Close-up of the rectangle of F in stereo showing the thioester region. Some residues of iECAM are labeled for reference, as is the intact thioester bond of nECAM and helix TED-α1 for both structures.

