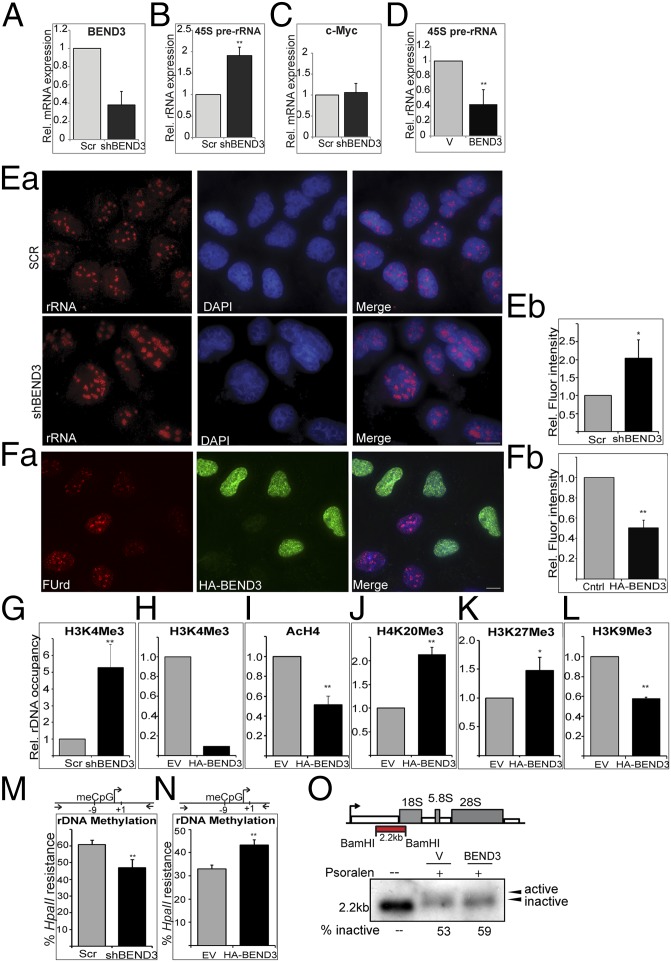
Fig. 2.
BEND3 represses rDNA transcription. (A) Validation of BEND3 knockdown by qRT-PCR using a highly specific probe-based Taqman Gene Expression Assay. Note greater than 60% reduction in BEND3 mRNA levels in cells stably expressing an shRNA against human BEND3 (shBEND3). (B) qRT-PCR analysis of 45S pre-rRNA transcript in control (Scr) and shBEND3-expressing cells. c-Myc is used a negative control in C. (D) Relative expression of 45S pre-rRNA transcript in cells transfected with vector (V) or HA-BEND3 (BEND3). Error bars represent SD; n = 3. **P value < 0.01. (Ea) RNA FISH analysis using a probe complementary to rRNA in U2OS cells stably expressing scrambled (Scr) shRNA or shRNA against BEND3 (shBEND3). (Eb) Quantification of the data from Ea. (Fa) Fluorouridine labeling in HA-BEND3–expressing cells. (Fb) Quantification of the data from Fa. (G) ChIP analysis using H3K4me3 Ab at the rDNA promoter in shBEND3-expressing cells and Scr control. (H) H3K4Me3 Ab ChIP in cells stably expressing HA-BEND3 relative to EV control (data are representative of two independent experiments). (I) ChIP using antibody against pan H4 acetylation (AcH4) at rDNA promoters in cells stably expressing HA-BEND3 compared with empty vector (EV) control. (J) H4K20me3 Ab. (K) H3K27me3 Ab. (L) H3K9me3 Ab ChIP in HA-BEND3 or EV stable cells. (M and N) Methylation-sensitive restriction analysis used to measure rDNA promoter methylation levels in BEND3-depleted cells (M) or in HA-BEND3–expressing cells (N). meCpG levels were measured by digestion with HpaII followed by qPCR of the indicated promoter region (schematic). Error bars represent SD; n = 3. *P < 0.05, **P value < 0.01. (O) Active and inactive gene fraction by psoralen cross-linking in vector or BEND3-overexpressing cells.

