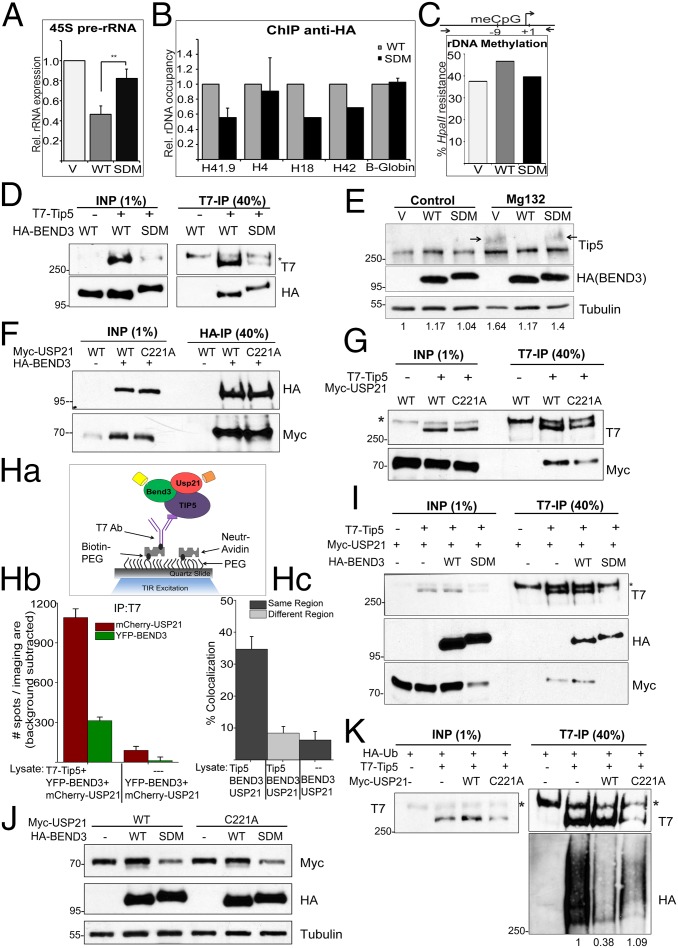
Fig. 4.
BEND3 stabilizes Tip5 via USP21 deubiquitinase. (A) Relative levels of 45S pre-rRNA transcript in cells transfected with pCGN (V) or HA-BEND3-WT (WT) or HA-BEND3 sumo double mutant (SDM) as assayed by qRT-PCR analysis. Error bars represent SD; n = 3. **P value < 0.01. (B) ChIP anti-HA in cells transfected with HA-BEND3.WT (WT) or HA-BEND3.SDM (SDM). Data are represented as percentage input normalized to WT. (C) rDNA promoter methylation levels assayed by methylation-sensitive restriction analysis in cells transfected with pCGN (V) or BEND3.WT or BEND3.SDM. (Data are representative of two independent experiments.) (D) Immunoprecipitation of T7-Tip5 with HA-BEND3.WT or HA-BEND3.SDM using T7 Ab. (E) Levels of Tip5 in cells expressing pCGN (V) or HA-BEND3 or HA-BEND3.SDM in control and upon MG132 treatment. Arrow denotes accumulation of ubiquitinated forms of Tip5. Relative intensity of Tip5 (as quantified by Image J) is shown at the bottom. Values are normalized to V in control cells. (F) BEND3 associates with USP21 deubiquitinase. Immunoprecipitation of HA-BEND3 and Myc-USP21 or USP21.C221A mutant using HA antibody. (G) Tip5 associates with USP21. Immunoprecipitation of T7-Tip5 and Myc-USP21 using T7 antibody. (Ha–Hc) Determination of Tip5 complexes containing both BEND3 and USP21 by SiMPull and colocalization analyses. (Ha) Schematic of YFP and mCherry molecules pulled down from U2OS cell lysates expressing T7-Tip5, YFP-BEND3, and mCherry-USP21 using biotinylated T7 Ab. Cell lysate expressing YFP-BEND3 and mCherry-USP21 incubated with biotinylated T7 Ab served as the control. (Hb) Average number of YFP and mCherry fluorescent molecules per imaging area (5,000 µm2). (Hc) Note 35 ± 4% overlap. (I) Immunoprecipitation from cells expressing T7-Tip5, Myc-USP21, and HA-BEND3 or HA-BEND3.SDM using T7 Ab. (J) SUMOylated BEND3 stabilizes USP21. Total levels of Myc-USP21 or Myc-USP21.C221A in cells expressing HA-BEND3 or HA-BEND3.SDM. (K) Ubiquitination assay in cells expressing HA-Ub, T7-Tip5, and Myc-USP21 or Myc-USP21.C221A. The Tip5 ubiquitination levels shown at the bottom of the gel were quantitated using ImageJ and normalized to the respective Input and IP levels.

